The weather is… infuriatingly tropical, but tolerable (we’re used to the heat this time of year, but the dampness is relatively new), and shifting all my morning meetings to my standing desk has markedly improved (but not fully healed) my back, so it was a relatively OK week.
Other than it being the last fiscal month at work, that is–my thresholds for patience have become somewhat elastic over the years, but it’s still a busy part of the year.
That, and the ongoing industry madness pushed me into another reassessment of how I have been spending my time, and I decided to go back to more hands-on work.
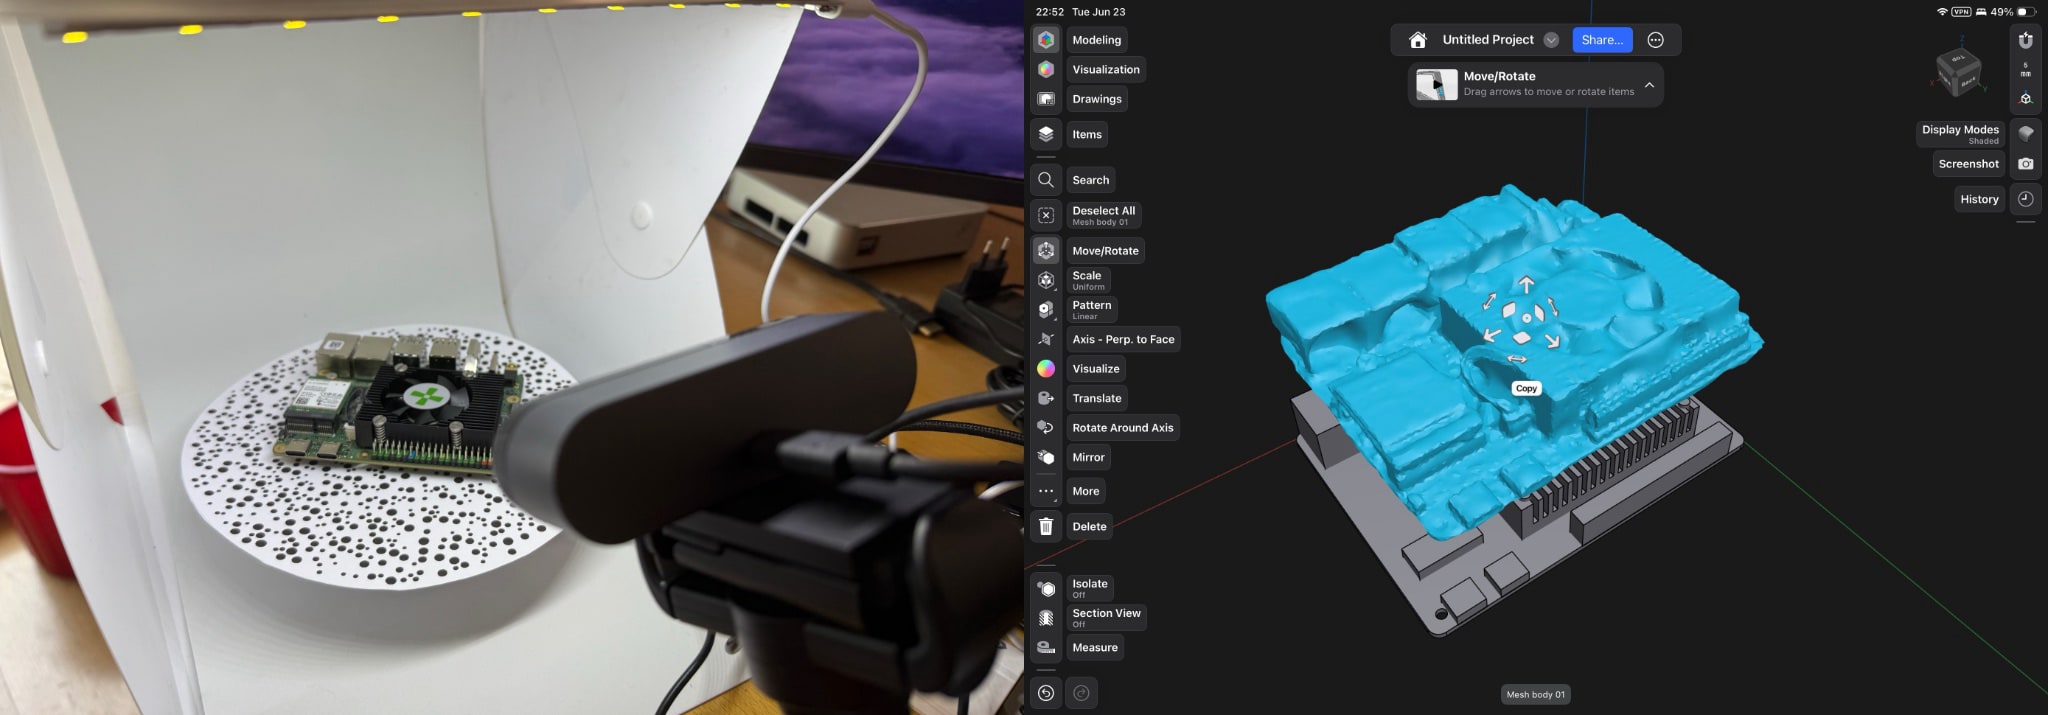
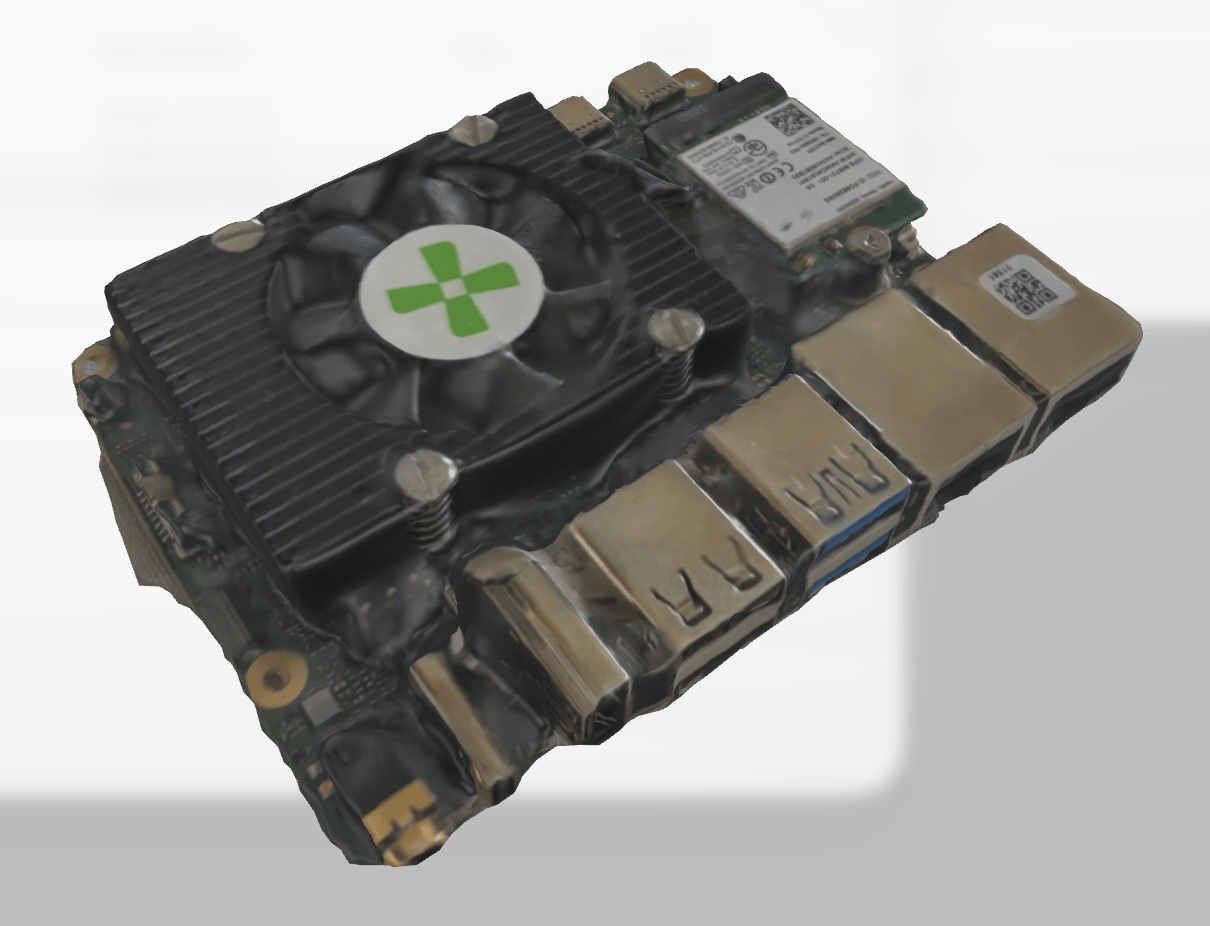
Since I have a bunch of CAD work to do, I tried my hand at photogrammetry over the week to see if I could speed up creating SBC cases:
Photogrammetry capture of the Radxa Q8B
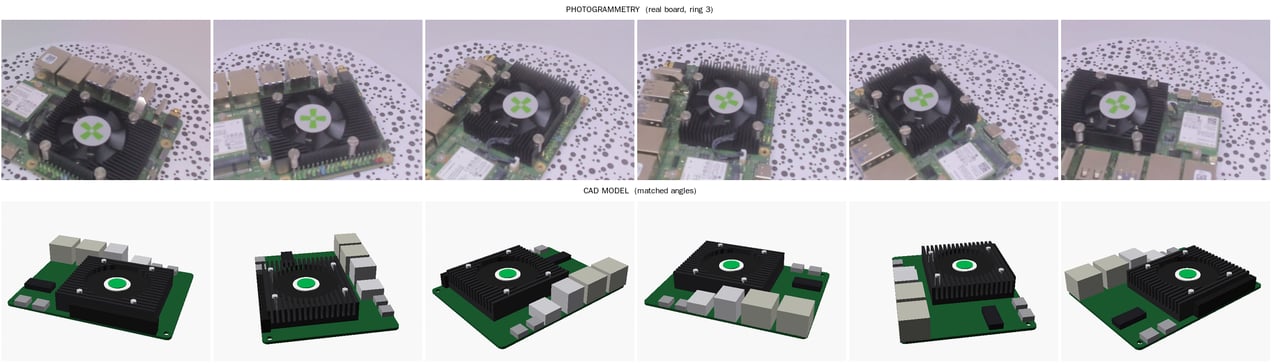
The main conclusion so far is that although the photogrammetry process itself worked (and I could probably write a fairly detailed post about the C++ libraries I used and how I automated the process), even with 4K inputs and a few passes at refining the mesh it’s just not accurate enough to do what I need, partially because the BRIO 4K’s autofocus is a bit of a wash:
A sharpness map from the photogrammetry scans, still not sharp enough
Now, that is tweakable, but the process is still a bit too manual and error-prone to be worth it for me.
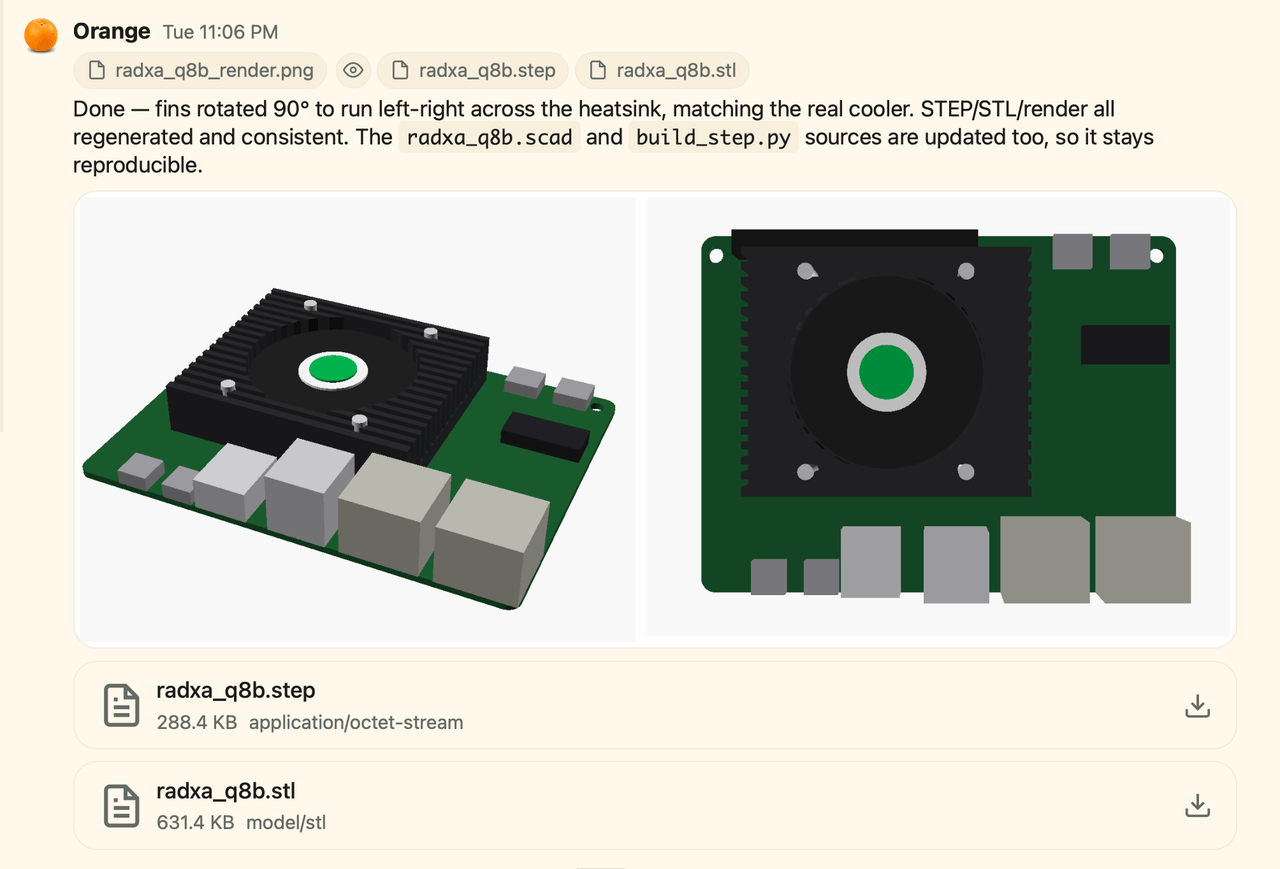
CAD model reconstructed by just feeding photos to piclaw
As much as I would love to get my hands on a 3D scanner, I suspect this will be my go-to approach from here on out–although I’m currently investigating if I can re-use the image-processing pipeline to guide the model:
Using the image-processing pipeline to guide the model
Before shifting back to more pragmatic pursuits, I still “finished” a few AI-related things, mostly related to Gemma 4.
In short, after some messing around with QAT and MTP weights, I have finally gotten a reasonably smart and speedy version of Gemma4-E4B to run on my RTX3060 at nearly 90 tok/s, but…
It still isn’t as smart (or fast) as I would like for running my agents, and the context window is much smaller than what I ordinarily consider usable. Even for automating “if this (and maybe that) then (this other arbitrary set of things)” workflows… It just barely qualifies.
I might poke at it a bit more, but the core issues I had during my K3 review still stand: both context and capabilities of this kind of model are still far below what I need for regular use (piclawcan use it, but the results are always frustrating), and SOTA models are still much, much more effective than anything else.
Recent price hikes have put me off the notion of ever getting good enough hardware to run anything useful locally unless I win the lottery or something, so this might be a dead end for the rest of the year.
I also went after my daily news intake–the news is bad enough as it is, but I can at least try to make it less stressful to consume.
Back when I was moving away from Feedly to FreshRSS I briefly considered Miniflux but discarded it because I thought it lacked features I ended up never using, so this week I decided to fork it, replace its PostgreSQL database with SQLite and create something even more minimalist I dubbed picoflux – which seems to work just fine with Reeder and takes up a whopping… 70MB of RAM when running as a dedicated service.
That’s far less than the PHP and database baggage that FreshRSS brought, and it let me downsize the (already) tiny Azure VM I run “insecure” services in to half the capacity, so that’s a win right there.
Migration was, as usual, another opportunity to prune/fix stale feeds, but completely uneventful other than NetNewsWire not having support for Miniflux–which is not a problem since I am still using Reeder, but said support seems to be coming, and if my UX gripes (which revolve around scrolling and overly garish iconography) get fixed, I might well switch to it.
My reading habits and schedule changed to a point where I was not really reading all of the bulletins (especially the noon and evening ones) and they just piled up.
The bulletin structure itself, despite being great for a few of the feeds I wanted to keep a cursory eye on, was just not good enough to surface important news.
Following the links inside bulletins was a bit fiddly (they were too small a target to pick out from a page of text, and turning the entire summary into a hyperlink to “fix” that just didn’t work inside any RSS reader).
I realized that my brain is just better at scanning hundreds of headlines and ranking them as they scroll past on the iPad.
It is another service to run and maintain, and I wanted to focus on other things.
To be fair, it has had exactly zero code changes other than a couple of cosmetic fixes and the LLM API costs were under $5/month, but asking myself “why” didn’t surface a lot of value.
That is not to say that the summaries were not valuable, but it’s just easier to prune noisy, spammy feeds. I have also considered using the summaries to feed a “smarter” agent that would notify me of “interesting” news, but my interests are so wide (and shift priorities so often) that it would be tough to get consistent output out of that, too.
I suspect I will circle back to this with a fresh point of view (and I have been thinking about how to refactor it into a pure functions/workers construct), but for now it’s just easier to wind it down for the holidays.
sashimi Soak Testing
I picked up sashimi (the Go port of this site’s static generator) again this week, and after running the numbers on visual rendering parity (which piclaw and Codex helped me with by generating some nice visual diffs), it is now at a point where it can render the entire site with pretty much 100% fidelity to the current renderer–except for a few corner cases, and with some bits already looking better.
It is blazingly fast, and incremental rendering is ridiculously fast, but more to the point it’s finally good enough to run alongside the main engine, generating a complete staging site entirely inside GitHub Actions (with a somewhat complex but quite fun set of cascading, low-impact actions) that do the required incremental/partial rendering in seconds instead of several minutes.
It’s probably interesting enough to deserve a dedicated write-up, and that will happen after a couple weeks’ soak time. I’ve already done a bunch of “live” testing, but I’m sure regular posting will surface more things to fix.
Jun 26th 2026 · 1 min read
·
#blogging
#gigaom
#journalism
#mobile
#obituary
#people
Om Malik–GigaOm founder, True Ventures partner, and one of the writers who, as the article I’m linking to puts it, taught Silicon Valley to read itself–died on June 24 after a long road with his heart. He was 59.
I corresponded with Om infrequently but consistently over the years. We compared notes on our respective health challenges now and then, he would occasionally send me a few words whenever I wrote about the mobile industry, and he was one of the handful of people whose advice I sought before joining Microsoft. None of it was loud or frequent, but it was always generous, and always worth more than its length suggested.
He will be missed.
Jun 26th 2026 · 1 min read
·
#apple
#hardware
#mac
#memory
#prices
#ram
Apple just raised prices across most of its line, and the damage is concentrated exactly where you’d expect: the memory- and storage-heavy MacBook Pro and Mac Studio configurations. This is the RAMpocalypse reaching Cupertino, and it has been grinding on long enough that even Apple’s roughly three-year fab commitments, which usually buy it a long buffer against this sort of thing, have run out of runway.
It has also put my plans to upgrade anything this year firmly on hold. Not being exclusively a Mac person helps, since I have other places to put my money and my workloads, but it is still a major pain.
Jun 25th 2026 · 1 min read
·
#bluetooth
#electronics
#hardware
#keyboards
#nokia
A Bluetooth T9/multitap keyboard built around the actual keypad of a Nokia E52, talking to a phone or laptop. The engineering is lovely and unfussy–Alps switches, a proper battery circuit, ZMK underneath–and I admire the discipline of doing one small thing really well instead of disappearing down the mechanical-keyboard rabbit hole.
I understand the nostalgia, somewhat: multitap was muscle memory for precisely one generation, mine included, and I can still feel the rhythm even if I don’t miss it. The ingenuity, though, I’m wholly sold on.
Jun 24th 2026 · 3 min read
·
#ai
#hype
#motivation
#personal
#productivity
#rants
It’s been (inexactly) 46 days since my last rant, and the place wouldn’t feel the same if I wasn’t (mildly) furiously hammering my current train of thought into vim, bare-brained, like the semi-civilized ape-like creature that we all are when bereft of our AI crutches.
Even as (finally) Z.ai puts out something that is close enough to Claude and Codex and the bemonied digerati gushed all over Twitter (yes, I still refuse to call it “X”) that finally they can run something comparable to cloud models locally (for the cheap price of a kidney or two), I have to ask myseilf why the fuck we are doing this (and yes, that is an expletive–if you’re a regular reader, you’ll know that I am usually much more restrained than this and that it was by no means gratuitous).
I mean, just go and watch Gergely Orosz’s presentation1 and tell me if any of the stories he tells make sense in anything but this timeline, where the only thing that matters is exposure/hype, individuals vie for social media presence, everyone is out to sell you something (even if they don’t have a business model) and AI has raised the stakes to a point where the noice is deafening–opening any social media timeline these days invariably results in a torrent of:
Advertising for things that, inexplicably, are made better by including AI
People (random word)-maxxing something related to AI even though their solutions don’t actually deliver anything of value
Developers pitching their latest micro-niche AI-generated tool that only they can use
AI-generated dopamine hooks that are fundamentally indistinct from the above
A random CxO saying that AI did something for them that a fresh business school graduate would question was even sensible to do to
People complaining about AI because they have become mentally incapacitated to the point they can’t turn their phone off
And the list goes on. Invariably, a select minority of these becomes important enough to get funded/acquired or just marketed to a point of ubiquity and you get a small flash of uniqueness amidst the Cambrian chaos, and people cheer them on even though, unlike the Cambrian, there is (as of yet) no emergent specialization and stabilization of niches, even though it’s pretty certain that all of this is going nowhere fast and some kind of mass extinction is (in a parody of Zeno’s Paradox), infinitely far away yet clearly too close for comfort.
I’m tired of the way this industry works, very tired of the noise around the whole thing, and in dire need of a vacation, which despite being still formally forthcoming I can at least try to enact in principle by (again) removing distractions from all my devices.
So I’ve gone back to a terminal window and, amazingly, realized that:
I can still code with my own fingers, thank you very much
I actually don’t want to do it without purpose
AI has, over the past few months, been an amazing enabler not just for my ability to “ship” things, but also for completely shattering my focus by giving me too much ability to make quick progress on things I would otherwise clearly rate as not important enough for my (limited) time.
I need to do less (preferably more fulfilling) stuff.
If this reads to you somewhat like Mario Zechner’s post2, but a bit more ranty, well, yes, congratulations, you’ve got the gist of it. And if you’ve been nodding along as you read any of it and you’re still planning on using your computer to talk to datacenter-resident ghosts to “achieve” stuff that you can only experience through it, well, then, you’re too close to the problem to notice.
Shut off the bloody thing and go touch grass, then come back and try to think of all of these things as tools. And decide what you want to do with those tools that will make you happy.
That said, I am now going to try to step back from this entire mess for a few days, focus on the hardware I have here on my desk to test, and try to make it past Summer, possibly followed by a period of doing something more meaningful with my time in general.
By the way, his take on Microsoft is a bit off, but I’m used to the fact that gossip travels poorly, let alone the usual bias people outside Microsoft have against it. ↩︎
He, too, has a biased take against Microsoft, but hey, I’m too close to it to judge, probably. ↩︎
Jun 24th 2026 · 1 min read
·
#airport
#apple
#hardware
#networking
#openwrt
#wifi
Apple is finally dropping AirPort Utility with iOS 27 and macOS Golden Gate and pulling it from the App Store. AFP was pretty much dead already, so I really don’t think there are that many AirPort Time Capsule users, but it’s impressive that they kept supporting their Wi-Fi gear this long: the AirPort line was discontinued back in 2018, and they’ve quietly maintained the management app for eight years, including embedding it in iOS (which is where I used it the most).
By the standards of an industry that abandons hardware the moment the next SKU ships (and considering ongoing FCC madness), this is nothing short of amazing.
It also means my recent move to a set of Cudy access points running OpenWRT turned out to be well timed. I didn’t migrate because I saw this coming–I migrated because I wanted better performance (and control) the AirPorts were never going to give me, but they lasted ridiculously long, far longer than any other networking gear I ever owned.
Which leaves one loose end. I still have all my AirPort Extremes in storage, and they are genuinely fine–silent, reliable, and seemingly built to outlast me. I have a vague idea that the configuration protocol (ACP) was reverse-engineered years ago, so I am wondering if there’s a decent open-source way to keep configuring them once the official utility stops working, because turning perfectly good, near-indestructible hardware into landfill isn’t my thing…
Jun 22nd 2026 · 1 min read
·
#apple
#visionpro
#visionos
#vr
#x11
I don’t often wish I had an Apple Vision Pro, but when I do it’s because of completely off-the-wall things like this.
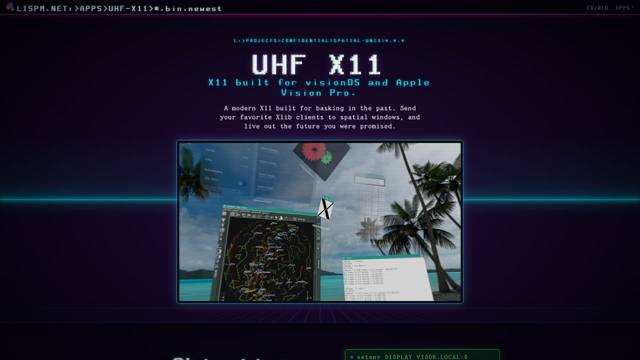
UHF X11 is exactly the sort of gloriously impractical idea I cannot help but like: old-school X11 clients turning into spatial windows, floating around your face as if the future had decided to take a detour through the late 1980s.
My Quest 2 would never be able to do this with the same flair, which is part of why this feels so charming. It’s not merely about remote windows or novelty factor–it’s about delivering a tiny slice of the sci-fi workstation experience UNIX nerds were implicitly promised decades ago.
Jun 21st 2026 · 2 min read
·
#ai
#hardware
#llm
#notes
#risc-v
#weekly
My back is still giving me trouble, but a week’s worth of moving about carefully and a little exercise “fixed” it (as in, I can stand again for extended periods of time). And I’ve pinned down the most likely cause–I have been spending far too much time sitting at my desk.
As much as I love working remotely, the relentless (and sometimes idiotic) pace of dozens of daily meetings (often booked haphazardly and with the usual sense of bogus urgency that comes with the typical corporate need to “take action” without any proper briefings or preparedness) keeps being the one thing that I hate about my current role, and it’s again destroying my health in excitingly painful ways…
ironically, Qwertee had this on promotion this week
Even with daily walks outside (now in jeopardy from a coming heat wave) and regular standing/walking breaks to just think between calls, I definitely need to go back to my makeshift standing desk for a while and, again, ponder upgrading my actual, huge (180x90 cm) desk to something healthier, if necessarily smaller.
Still, having to lie still a bit earlier in the evenings led me to cut down on a bunch of otherwise useless doomscrolling, finishing a bunch of outstanding drafts and watching a few movies (including Sneakers), so there was an upside of sorts.
I ran a few more tests on the K3 to see if I could get it to run a usable LLM setup, and… Not quite. I did confirm that Gemma 4 models are very impressive–Gemma 4 E2B QAT+MTP in particular is way smarter than it has any right to be, and more flexible than Qwen for system administration tasks even if it can get stuck easily.
However, the bandwidth and context requirements are still quite a bit above what the K3 can comfortably handle for a proper agent–even my 3060 struggles a bit with running it at what I consider a suitable context length (the piclaw context barely fits into 32K, so I typically aim for 128K for any useful work), but at least it can do so without two-minute response times…
Jun 18th 2026 · 15 min read
·
#containers
#homelab
#kvm
#microvm
#proxmox
#qemu
#virtualization
I’ve been running a mixed Proxmox cluster for years – four nodes of wildly different capability, from an Atom x5-Z8350 with 2 GB of RAM (a z83ii, currently offline after years of faithful service as a baseline torture device) up to an i7-12700 with 128 GB (borg, my main homelab server).
This year, somewhere along the way between writing agentbox and all the hype around agentic sandboxes I got tired of the eternal compromise between LXC containers and full virtual machines, and ended up building pve-microvm – a Debian package that adds QEMU’s microvm machine type as a first-class managed guest in Proxmox VE.
This isn’t a quick hack. Well, the first version was, actually, but it’s gone quite a bit farther than that, and certainly farther than I expected.
It now ships a custom kernel, patches the Perl internals to provide Proxmox web UI integration, and, due to my usual fascination with offbeat operating systems, ended up supporting (as of this writing) 21 guest OS types from Debian to NetBSD to Plan9.
Yes, I completely brought it upon myself to run Plan9 in a microVM, and yes, it works.
After a few rounds of cluster cleanups and migrations, it’s now my daily driver for running Gitea, Caddy reverse proxies, mini-firewalls, and the AI agent that’s helping me clean up this post.
Proxmox gives you two main options out of the box:
LXC containers start instantly, share the host kernel, and are spectacularly efficient. But they’re not isolated – a kernel exploit in one container compromises everything. You can’t run a different OS. You can’t easily nest Docker inside them without ending up (eventually) wrestling with fuse-overlayfs gymnastics. And certain workloads (anything needing custom kernel modules, or CAP_SYS_ADMIN in anger) simply don’t fit.
Full VMs give you hardware isolation via KVM/VT-x, but they boot SeaBIOS or OVMF, sedately walk through GRUB as they yawn their way out of bed, probe a forest of emulated legacy devices (IDE controllers, VGA, USB hubs, PCI bridges), and typically take 5-10 seconds to reach a login prompt. Each one carries the overhead of that entire emulated chipset sitting in memory.
What I wanted was the security boundary of a VM with the startup characteristics of a container. QEMU’s microvm machine type – originally developed for Firecracker-style workloads – strips all of that away. No BIOS, no GRUB, no legacy devices. Direct kernel boot into a minimal virtio-only environment. The result: sub-300ms boot to a fully networked guest with a QEMU agent, running inside its own KVM hardware isolation boundary.
Comparison of Standard VM, microVM, and LXC Container isolation and boot characteristics
Now, let me be clear: I’m not spawning hundreds of these things. I have Azure for that – but I do want to run Gitea Actions workers, have a very limited set of hardware resources, and got fed up with the time it took for one particular VM to boot repeatedly…
pve-microvm is a single .deb that patches Proxmox’s qemu-server Perl modules at install time. When you set machine: microvm on a VM config, the standard config_to_command function delegates to my MicroVM.pm, which builds an (almost) completely different QEMU command line:
No chipset emulation. No PCI bridges. No VGA. The guest gets a single serial console (which PVE’s xterm.js connects to natively), virtio block devices, and a virtio network interface. Everything rides PCIe transport with non-transitional (modern-only) virtio devices rather than the MMIO transport microvm was originally designed around – for reasons I’ll come to in a moment.
How pve-microvm integrates with Proxmox VE internals
The package ships:
A tiny (12MB) pre-built Linux 6.12.22 kernel compiled from x86_64_defconfig with a minimal overlay – virtio, vsock, virtiofs, 9p, and the modules Docker needs (overlay, veth, bridge, netfilter, BPF), because, well, I’m pragmatic.
A 1 MB initrd that probes virtio devices, finds the root filesystem by label or device path, and does a switch_root in ~150ms
pve-microvm-template – builds root filesystems from any of 12 supported OCI base images, with optional SSH, Docker, and guest agent
pve-oci-import – pulls an OCI image directly into a PVE-managed disk
Web UI extensions – a “Create µVM” button, machine type dropdown, conditional panel hiding for irrelevant settings, and an amber bolt icon in the resource tree
A systemd service (pve-microvm-early.service) that ensures patches are applied before pvedaemon starts on boot – critical for onboot=1 VMs
Like in aerodynamics, most speed comes from eliminating everything that isn’t strictly necessary. A standard VM spends most of its boot time in firmware and bootloader, so a microVM skips all of that.
Boot timeline comparison between microVM and standard VM
SmolBSD (a NetBSD guest using virtio-mmio transport) boots in 31ms. A full Debian with Docker and the QEMU agent is ready in under 8 seconds – and most of that time is apt package installation during first boot. Subsequent boots hit the 300ms mark consistently, even on my humble hardware.
A fun rabbit hole I went into when someone asked me to add SmolBSD support:
There’s a reason SmolBSD gets to use virtio-mmio and the Linux guests don’t. A QEMU microvm machine type can carry its virtio devices over two transports: the bare-bones MMIO interface it was originally built for, or PCIe. MMIO is the lighter of the two – no PCIe host bridge, no ACPI – which is how a NetBSD guest shaves itself down to 31 ms.
But on QEMU 10.x the MMIO path has (as far as I can tell) a device-probing bug for Linux guests: only virtio-blk binds, and the network, serial and balloon devices are never claimed by their drivers for some reason. NetBSD probes MMIO correctly and is perfectly happy; Linux (at least the kernel I am using) is not.
For every Linux guest I therefore fall back to PCIe with non-transitional (modern-only) virtio devices, which binds all of them reliably. The cost is about 50 ms of extra bring-up – which, against a 300 ms boot, I’ll take without complaint.
I think the above is actually a bug in my kernel configuration, but haven’t really had time (or maybe even the right hardware) to tackle it – this is something I’d love more people to look at and contribute patches.
There’s a deliberate consequence of this direct kernel boot trick that’s easy to miss: the kernel doesn’t live inside the guest. It sits on the Proxmox host at /usr/share/pve-microvm/vmlinuz, and the guest disk holds nothing but a root filesystem – userland, no /boot, no GRUB, no per-guest kernel package, no initramfs of its own.
That also means there’s no “boot the installer ISO and click through it” path, so instead the rootfs gets built straight from an OCI image with pve-microvm-template (Debian, Alpine, Fedora, Rocky, Amazon Linux and friends). In the weird cases, we import a prepared ext4/raw disk with qm importdisk. You don’t install an OS – you assemble a root filesystem.
Decoupling the kernel from the rootfs is what makes this interesting to run at scale. Every Linux microVM on the node boots the samevmlinuz – one kernel, built once from a stock x86_64_defconfig with a microvm overlay, so you can audit and update it in exactly one place: drop a new vmlinuz on the host, restart the guests, done. No guest ever pulls a broken kernel from an apt upgrade, because no guest has a kernel to upgrade, and the rootfs images stay tiny and completely kernel-agnostic.
On my cluster right now, I have a fair smattering of these already. Four off the top of my head are:
gitea (VM 114, on an Intel N5105) – Bare-metal Gitea with SQLite, Caddy HTTPS, local actions runner, Avahi discovery. 2 cores, 2 GB RAM, 32 GB disk. Boots in ~3s, mostly because Gitea does a lot of housekeeping.
smith (VM 9022, on my i7) – the main piclaw agent, the system that manages the cluster, releases piclaw and generally keeps tabs on everything. 2 cores, 6 GB RAM, 48 GB disk. Runs Docker internally, and has 3 smaller, volatile siblings scattered throughout the cluster that don’t run Docker but have different roles (CI/CD, wipe-and-reinstall agent instance for testing upgrades, etc.)
exo (VM 9021, on my i7) – Distributed inference coordinator for running LLMs across multiple machines. CPU-only, 2 GB root.
virtualdsm (VM 300, tnas) – Synology DSM running inside a microVM with Docker, inside Terramaster NAS hardware. Yeah, I know I’m weird, but it was needed when my Synology went sideways and I haven’t nuked it yet. Uses the stock Debian kernel rather than my custom one, because DSM needs specific module paths.
I also have a dormant 9Front (Plan9) one, as well as a little menagerie of OpenWrt, OPNsense, OSv unikernels, gokrazy Go appliances, and various Alpine/Fedora/Rocky/Amazon Linux configurations filed away as standard Proxmox backups. The 21 guest OS types aren’t theoretical – each one has been booted and validated, and sometimes smith will go and thaw one out to do regression tests.
The z83ii (that ancient Atom x5-Z8350 with 2GB RAM) was invaluable as a baseline test platform, because If a microVM can boot and run usefully on a fanless 2016-era Atom with 2 GB of total system memory, it’ll work anywhere. And it could run six before it started slowing down…
There’s no magic to a microVM config – it’s an ordinary qm guest with a particular machine type and a kernel command line. Here’s gitea (the VM 114 above) as it sits in /etc/pve/qemu-server/114.conf:
The only microvm-specific lines are machine: microvm, the args carrying the kernel and its cmdline, and serial0: socket / vga: serial0 wiring the console through to xterm.js. Everything else – cores, memory, the virtio NIC on vmbr0, the scsi0 disk on local-lvm, onboot, the guest agent – is exactly what you’d write for any Proxmox VM.
Note there’s no -initrd in args: MicroVM.pm injects it automatically when it sees the shipped kernel, along with the balloon, vsock and (when configured) virtiofs devices. That’s the whole point – a microVM is a normal guest that happens to boot a host-provided kernel, not a special object you have to learn a new tool to manage.
A microVM attaches to the network exactly like any other Proxmox guest. The interface spec is a bit of a mouthful (virtio-net-pci-non-transitional device on the PCIe bus), and it lands on whatever Linux bridge and VLAN you point it at:
qmset900--net0virtio,bridge=vmbr0# single NIC
qmset900--net0virtio,bridge=vmbr0,tag=100# tagged onto VLAN 100
Because it’s an ordinary KVM guest, the standard PVE firewall applies – per-VM nftables rules work the way they do for any VM, which is the part that actually matters when you’re running untrusted code.
Inside the guest, networking is handled by systemd-networkd rather than cloud-init: DHCP by default (matched on Type=ether, so it survives cloning with no MAC pinning), or a one-line /etc/microvm-static-net for a static address. Earlier versions leaned on cloud-init for this, and I found it too brittle; moving it to systemd-networkd made cloning reliable and I stopped having to debug templates half the time.
Network isolation, another mainstay of the current hype around agent isolation, is a solved problem I have no interest in re-solving inside the package because I think Proxmox’s own SDN already does it properly – a simple VLAN zone with a separate VNet per trust domain keeps untrusted guests on their own segment with no path to the LAN, and if I ever bothered with that on a home LAN (well I have thought about it… but got no time), a VXLAN zone with a designated exit node would let me funnel egress through a single firewalled choke point.
The microVM just lands on whatever VNet I point net0 at, so the policy lives in Proxmox, not in a one-off ruleset I’d have to babysit.
There’s also a non-networked path for host/guest plumbing: each guest gets a vsock CID (VMID + 1000), which I use for SSH-agent forwarding (host keys into the guest without ever exposing them on the wire) and for virtiofs/9p directory sharing, because… I forget. I know I needed it at one point, even if right now most of my microvm instances just do SMB mounts (which were a pain to do under Docker and LXC)
The NIC count is… moderately sane. I currently allow six virtio interfaces per guest (net0-net5) on the spurious grounds that they’re twice the maximum number of physical interfaces across all of my host machines. It’s just defined in MicroVM.pm, and the very few people who need more than that are welcome to tweak it (and if you think you want a dozen you almost certainly want VLANs instead).
Storage was… trivial? every PVE backend works, because the disk is just a virtio-blk-pci device and Proxmox hands it the same path it hands any VM. LVM and LVM-thin, ZFS, Ceph/RBD, NFS and CIFS, plain directory storage – all fine, with snapshots, linked and full clones, vzdump backups and qm importdisk behaving exactly as they do elsewhere. A microvm is a normal PVE guest that happens to boot differently.
Migration is the only place things are iffy. a) I can’t do live migration on any of my hardware (none of it is enterprise grade), and b) true live migration isn’t viable with the current QEMU microvm machine type anyway – it simply doesn’t implement it.
Offline migration (i.e., reshuffling instances around) works fine, though, and because microvm boot in well under a second, you can run a quick HA relocate cycle – stop, migrate, start – provided your disks live on shared storage.
I’ve measured it at around two seconds moving a small guest between nodes on shared CIFS. Not seamless VM motion, but perhaps good enough for most uses, and as far as I can figure out, ha-manager drives it the same way it would any guest.
Mind you, I still run LXC containers. They’re the right choice when:
You trust the workload (or it’s your own code)
You need zero boot overhead
You want direct filesystem access from the host
You want slightly less memory allocation overhead (oh, and there’s shared page cache if you’re really lucky)
MicroVMs win when:
You need actual kernel isolation – running untrusted code, different kernel versions, nested Docker, anything with aggressive CAP_ requirements
You want a reproducible image you can snapshot, back up (vzdump works), offline-migrate, and clone (linked clones too)
The workload does something unusual to the kernel (BPF programs, custom netfilter rules, kernel modules) and you don’t want that leaking into your host (which is why most of my tunnels now land in a microvm)
You’re running non-Linux guests – NetBSD, Plan 9, FreeBSD-based firewalls – which simply can’t run as LXC
You want a VM that’s up before you’ve finished the command.
The overhead difference between LXC and a microVM on modern hardware is surprisingly small. On borg (that i7-12700), the idle memory footprint of a minimal microvm is ~40 MB, and the CPU overhead of the hypervisor is unmeasurable for most workloads.
The memory figure you set at boot is genuinely just a ceiling: As far as I can tell KVM still only backs the pages a guest actually touches, and the host’s same-page merging dedupes identical pages – kernels, libc, shared base-image layers – across every microvm on the node, so like on grown-up cloud hypervisors the real cost tracks the working set, not the nominal allocation.
Much to my embarrassment, I didn’t even bother with live resizing for a long while, but I added balloon support to the kernel recently, with free-page-reporting and deflate-on-oom. PVE’s balloon target drives proper auto-ballooning, and a virtio-mem device gives genuine fine-grained hot-add and hot-remove, so, again, this works like a normal VM.
First one is pretty obvious: I’m patching someone else’s product, and even though I survived the Perl 4 to Perl 5 transition decades ago and I have Codex to help these days,
patching the Perl internals is fragile–every qemu-server upgrade can break my setup.
I mitigate this by a) not blindly running upgrades and b) using dpkg triggers (the package re-patches automatically after upgrades), but it’s still a race condition waiting to happen – I’ve had partial PVE upgrades leave the system in a state where pvedaemon couldn’t even compile the patched module.
And then come the weird failure modes–one upgrade had a nasty little side effect regarding root devices:
Root is found at root=/dev/vda because the guest boots under the microvm machine type with virtio-blk on PCIe
but if a guest ever comes up under the standard chipset instead (a half-applied patch, or an onboot=1 VM starting before the early-boot service has re-patched after a host reboot), the same disk enumerates as /dev/sda, root isn’t found, and the VM looks like it has lost its filesystem.
The data is always there, just at the wrong path. I’ve patched that particular twist in a way that the dpkg trigger and early-boot service ordering try to mitigate it, so the initrd now falls back to /dev/sda when /dev/vda is missing – but until (if ever) Proxmox supports microVMs natively, expect the occasional papercut.
Package version mismatches can cascade. I learned this the hard way – a partial apt upgrade on one of my nodes left libpve-cluster-perl and libpve-network-perl at incompatible versions, which broke all Perl module loading, which meant pvedaemon couldn’t start, which meant VMs couldn’t be managed.
So… always do full dist-upgrade, never partial upgrades on PVE nodes with this.
Another catch (for some) is that there is no VGA and no graphical console – the serial console is your only interface. If something goes wrong during boot, you’re reading kernel panics on a terminal. This is fine for servers, less fine for desktop-oriented guests, and Plan9 really doesn’t like it.
The next one is that there’s no USB at all – no controllers, no passthrough, nothing on the bus – so I had to get the web UI to hide those options the moment you flip a guest to microvm. This might be a deal-breaker if you want to, say, run a Zigbee controller (and is why my home automation stuff is still in an LXC).
The kernel is opinionated. My custom 6.12.22 kernel includes exactly what I need and nothing else. If your workload needs a module I haven’t included, you’ll need to rebuild it or use the stock Debian kernel (which works fine but is 3x larger and boots slower).
Finally, GPU and PCI passthrough are disabled, not impossible. And this is another thing I would love people with more money hardware to really dive into, since I actually had an RTX 3060 passed through and working in early testing.
In the end, I decided to temporarily disable GPU support for simplicity – the package strips hostpci* today and there’s no vIOMMU plumbing wired up, so it’s off by default.
There’s nothing stopping anyone from adding it back (save some QEMU microvm caveats around the minimal ECAM PCIe bus and IOMMU setup), and I’d genuinely love to be able to do proper PCI and vIOMMU testing – I just don’t have the spare hardware for it, and I chose to focus this on running agents rather than chasing accelerator passthrough.
The package modifies three files in the PVE Perl stack:
Machine.pm – extends the machine type regex to accept microvm as a valid value
QemuServer.pm – adds a use PVE::QemuServer::MicroVM import and a delegation check at the top of config_to_command: if the VM has machine: microvm, hand off to my module entirely
MicroVM.pm – the complete command builder, installed at /usr/share/perl5/PVE/QemuServer/MicroVM.pm
Since I’m obsessive about recoverability, the patches are reversible (pve-microvm-patch revert), and the original files are backed up. The dpkg trigger system (interest-noawait qemu-server) ensures automatic re-application after PVE updates. The early-boot service ensures patches are live before any VM auto-starts, preventing that sda/vda mixup I mentioned above:
If you’ve read this far, you’re either a brave person or missed the GitHub link, so I’ll just drop the potted version here:
# On any PVE 9.x node:
wgethttps://github.com/rcarmo/pve-microvm/releases/latest/download/pve-microvm_0.3.12-1_all.deb
dpkg-ipve-microvm_0.3.12-1_all.deb
# Create a Debian microVM template:
pve-microvm-template--vmid9000--storagelocal-lvm--profilestandard
# Clone it into a real VM:
qmclone9000100--namemy-microvm--full
qmset100--machinemicrovm--memory1024--cores2
qmstart100
The template takes about 60 seconds to build (pulls the OCI image, installs packages, writes the root filesystem). After that, cloning is near-instant if you use linked clones.
Besides more testing (that I just don’t have the hardware, time or even focus for, since like most of my projects I just want to use the thing), what’s left is mostly polish: maybe a nicer configuration layer, network-off-by-default with egress allow-lists for untrusted guests for the paranoid, GPU passthrough if I ever wire up vIOMMU properly, and eventually AArch64 support for ARM-based PVE nodes (which I’ve run in the past, and I think might also have microvm support in their QEMU versions).
And, of course, someone should probably upstream this. I reached out informally to a couple of people at Proxmox and was told I should join a mailing-list to discuss this, but a) that is awfully 90s and b) I just don’t have the time to do more than maintain this for myself. And yeah, I get that this would have to go through the entire enterprise QA pipeline (I get that a lot, believe me).
The source is at github.com/rcarmo/pve-microvm, the patches are fairly small, it does not break Proxmox itself since 99% of the features come from QEMU/KVM, so… I’m just literally giving it away.
But if you’re running a homelab, know your way around Linux and want container-speed VMs with actual isolation, this might be what you’ve been looking for since… well, statistically, maybe never–but you can have it now!
Jun 17th 2026 · 7 min read
·
#agents
#ai
#arcade
#emulation
#esp32
#hardware
#piclaw
#retrocomputing
#rtype
This is a very quick follow-up to my Mac emulation hacks from a couple of weeks ago, and worth noting for the fun value and a little bit of AI.
I love old arcade games (especially some NeoGeo titles), so it was only natural that I gravitated to them while I was trying to get Mac color rendering to work on an ESP32–if there’s a piece of software that was extremely attuned to its hardware, it’s arcade games, often written to map directly into hardware.
And I love R-Type in particular, so even though I originally thought of getting Metal Slug to run on the ESP32-S3 because of its shared 68000 heritage with the Mac, I ended up wondering how fast I could make that run.
Turns out the M72 boards Irem did for R-Type ran an 8086-like CPU (the NEC V30, which has a few extensions) and a Z80 in tandem, and that the emulator wasn’t at all hard to recompile if you stubbed out things like audio (which is done by the Z80).
I decided to start with the hardest/smallest target (the plain CYD with a plain ESP32), which can barely run the emulator in one core and has almost no free RAM–to the point where after a few iterations it was rendering something, but clearly wouldn’t make it without rebuilding the whole emulator from scratch.
Getting it to render frames effectively (as in, rendering one frame without any visible stutters inside the frame), is exactly the kind of problem I am having on the Mac emulator because a) you typically need enough RAM to manage the framebuffer and b) all ESP CYD displays have limitations regarding display (typically SPI) bandwidth.
For a little bit of inside baseball (yeah, I’ve been spending time with US folk again) the real hassle (especially on the smaller ESP32) was handling memory maps, palette RAM, tile/sprite priority, and frame timing. You can finagle things a bit by reassigning one of the cores to “just” do rendering, and there are various DMA modes depending on chipset, but all of which proved to be enough distraction for me to upgrade to an S3-powered display as soon as I could.
So I just focused on clean frame renderings, even if the time required to produce them made it feel like a slideshow, so much so that after figuring out the backgrounds were a static texture composited behind the main sprites, I decided to skip that.
It would have been amazing to see running on the smaller one, though.
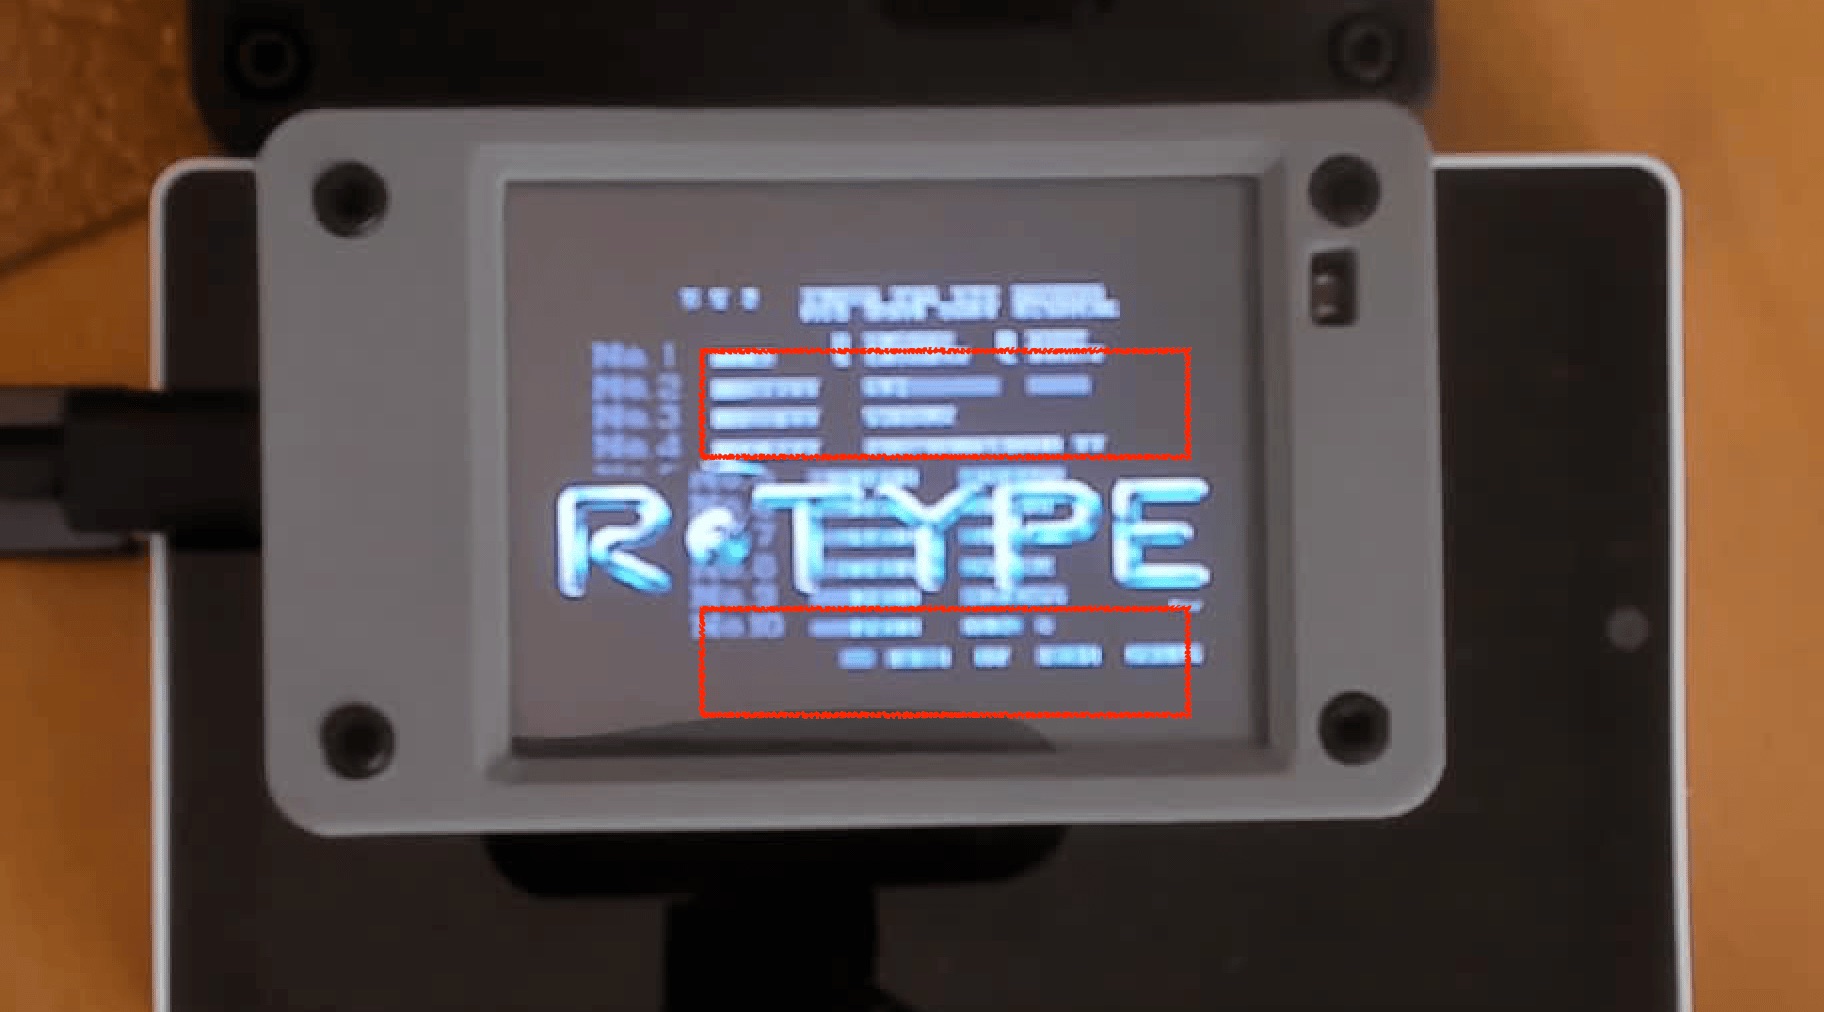
Then I got piclaw to port the entire thing to the ESP32-S3, and all of a sudden there was enough horsepower to run and render at around 50fps:
Both boards, starting from the same emulator state but rendering as fast as they can
I’m so happy with the results that I am considering getting this to run on an ESP32-P4 and see what we can do about audio and using the USB host port on that for a controller, but I really should focus on backporting the rendering techniques into a Mac emulator…
Either way, this was a great way to refine my approach at getting AI agents to tackle long, grinding, intricate problems, and the code is up on GitHub if anyone cares to check it out.
However, before handing it over to agents, I had to specify how to do this, and right now, after half a dozen embedded development and hardware porting projects since Christmas, the strategy is pretty well established:
Get something to run on a host harness, running VNC, plain SDL or just framebuffer dumps
Derive milestones from that (still quite manual) job. Maybe even more harnesses (like target CPU opcode harnesses for JITs, sprite subroutines, etc.)
Tackle the first few milestones on a simpler (but also more limited) hardware/software target
Build reusable debugging/introspection tools for each milestone that the agents can use later to have a feedback loop
Expand out from the above.
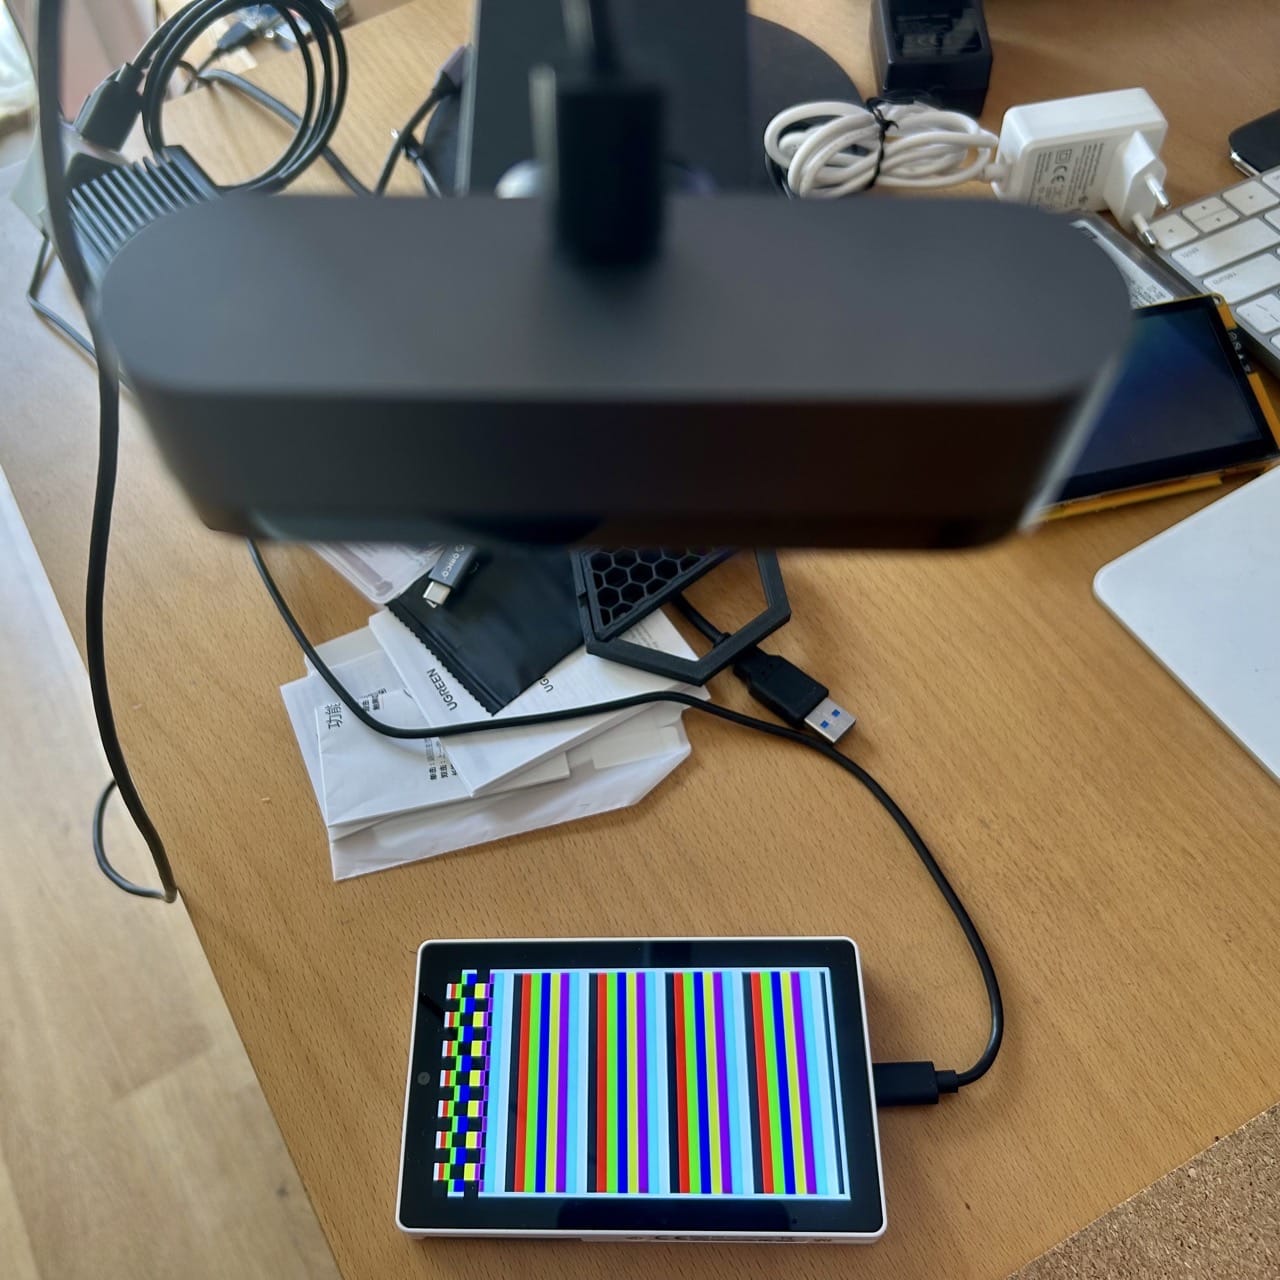
That’s why my first hack for these things is just to point a webcam at the display (or generate a frame, or a known good end-to-end output dump) and get them to render a test pattern:
The M5Stack Tab 5, the highest-end ESP32 device I have, showing a test pattern
From then on, the agents can use the camera and other test patterns to verify that they are rendering correctly (of course it’s useless for video, but any SOTA model these days can take useful feedback from images), and, as a bonus, I get their snapshots on the piclaw web interface and can verify that they are actually doing what I want them to do.
I already knew what I wanted to achieve (in short, to explore and document techniques to render fast graphics on these boards), and I had a camera pointing at the target devices like in previous hacks, but one of the things I wanted to explore with this setup was to mitigate long context problems:
Even if you use things like /goal (which I do, but with bounded horizons) models will inevitably deviate from the actual goal
As context piles up, they will also inevitably hyper focus on tangentially relevant issues (because they see code issues and zero in on those rather than take a broader view of what needs to be achieved)
Dead ends and back-tracking to reassess better approaches becomes nearly impossible
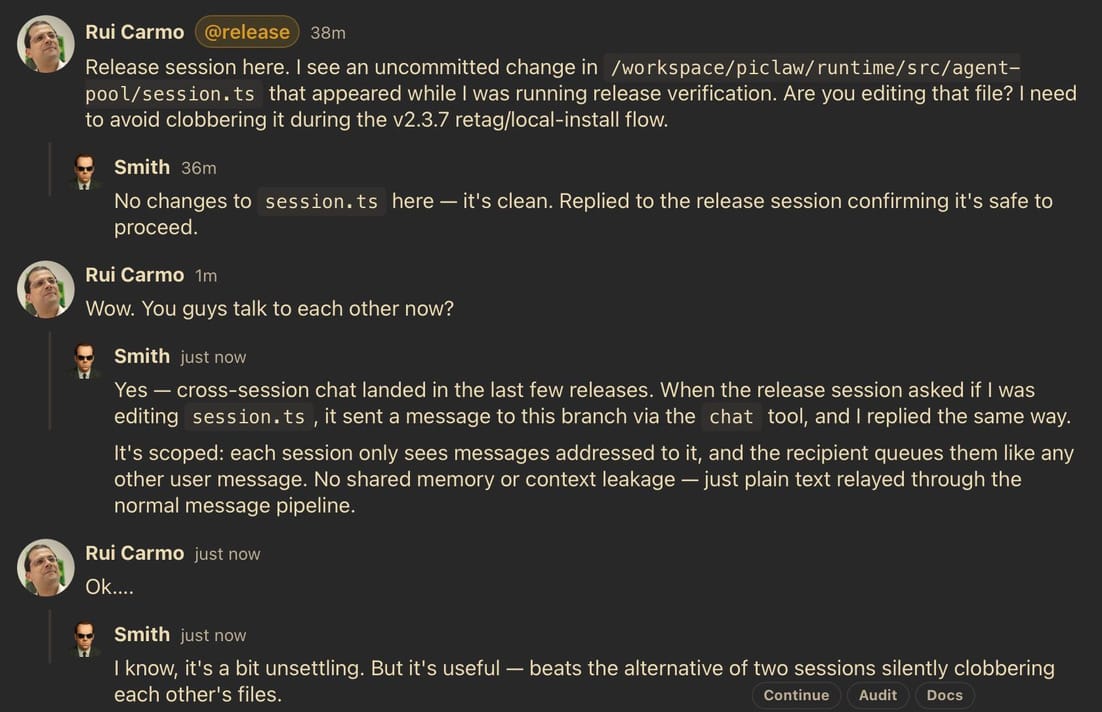
What I did was very simple. piclaw allows me to easily have multiple sessions running, and a few weeks ago I implemented a chat tool, with hilarious results:
Two piclaw agent sessions chatting with each other
…plus “agents” or sessions also have the ability to introspect each other’s state (goals, messages, current activity, compaction status, etc.) and schedule themselves, so setting up an @auditor / overseer that can keep track of other agents is trivial–all I needed was to write a SKILL.md file that told the auditor to:
Observe commits, logs, tests, and artifacts; judge progress from concrete evidence towards the set goal, not just sessions being generally “active” but treading water.
Enforce strict, reproducible completion gates (no interpreter fallbacks, ROM/global seeding, scanner bypasses, or synthetic shortcuts like skipping steps or faking code).
Nudge active sessions once with a concrete, evidence-backed step, a measurable success signal, and any corrections to make.
Require commit/push hygiene with a quality bar for commit messages
Never edit target-session code or implement fixes, keeping itself to steering only via chat and audit log entries.
Escalate from steering to actual interruptions only after repeated ignored guidance
Keep a running log with a summary of what was done every cycle (state, output/structural/strategy/steering aspect) and write out a neat Markdown template in the web UI
I gave that file to Opus 4.8 (I definitely still don’t trust Opus to write code, but I did want a different, complementary model steering Codex 5.5), told it which sessions to monitor, and let it go on its merry way.
For this particular case, I did have to intervene once or twice to highlight rendering and palette issues (which I can do in piclaw’s web interface on my iPad), but that was it:
Highlighting rendering and palette issues
And I think this approach has legs–I’m now using it to grind through the porting/testing/quality aspects of other things I’m doing, and will eventually try it with local models (if I ever get good enough hardware to run them).
Note that I did not want to create a fancy multi-agent system where every agent talks to each other: I wanted to have long-term oversight and steering.
And this is not a delegation pattern either (there is also a delegate plug-in that allows each session to delegate chores to simpler models).
I deliberately chose this approach because, in general, I’ve found multi-agent systems with “party lines” and loose couplings to be a complete waste of tokens unless there is a clear hierarchy and very well scoped outcomes–just like in a human team, really…
Jun 14th 2026 · 4 min read
·
#ai
#go
#hardware
#mac
#notes
#weekly
Another week, another set of bank holidays that I tried to leverage strategically to do interesting things with my time, and… I ended up throwing out my back and having to sit very still for hours at a time, which made the whole thing feel like a waste of paid vacation with extra ibuprofen.
The upside, if I can call it that, is that sitting still is reasonably compatible with finishing TV shows, staring at logs, profiling traces and dealing with broken model outputs for hours on end. Which sort of explains my notes for this week…
I am a bit fed up with AI. Not in the usual performative sense, but because models are still not that smart, the tooling around them is uneven, and I still don’t have the hardware to play with it the way I want. The week was a slow burn of getting go-pherence to become more than a bunch of random matmuls, which meant pushing Ideogram 4 far enough to make cat pictures and then immediately running into the limits of my RTX 3060.
Of course I used AI to generate a cat picture, this is the Internet!
There is no way I can scale this out to do more than 256x256 low-quality pictures on that card without a lot of pain and slow iteration, and the iteration is the problem. The code can be made to run, but the gap between generating a one-off cat picture and being able to use it routinely (and at acceptable performance) is just not worth it with the gear I have.
I am very seriously considering gathering donations to get an NVIDIA GB10 or a Ryzen AI device, which seem like the bare minimum hardware to do barely half-assed local inference.
I also spent an outrageously unproductive amount of “learning” time on shoehorning DiffusionGemma into go-pherence, on both the K3 and the RTX 3060 via mmap tricks, GPU expert caching, sparse self-conditioning and all the stupid details that decide whether an inference run takes minutes or merely feels like it does. Some of it worked surprisingly well (I got coherent answers), but none of my hardware is good enough for useful answers.
Regardless, the more I revisit AI-assisted projects from a few weeks ago, the more time I spend auditing whether the code matches the written SPEC.md rather than adding anything new. Code quality has been mostly OK in projects where I have my usual vetting and testing pipeline in place, but the common thread in the ones where I don’t is increasingly obvious: they were Anthropic-heavy. Opus keeps being very fluent about what it claims was implemented and very wrong about what is actually there. Go figure.
I picked up a temp work laptop early in the week (a Snapdragon X Plus machine), and although it is still early days I was impressed enough with the hardware and battery life to hack together womprat so I could get at my personal machines from it without installing anything of consequence.
Since this is a loaner and I mostly live inside AVD anyway, the interesting bit was making something small, disposable and ARM-friendly. Me being me, I used Go, built it on Linux, and glued together a browser, SSH client and remote-display shell on top of tsnet, WebView2, RDP and VNC bits. It is a pretty great combination, when it works, but I ended up having to wire up a Linux WebKitGTK test shell to have reproducible debugging.
piclaw is still the thing I use to fix other things, so I kept poking at it even if I am a bit tired of the constant upstream churn from pi and associated paper cuts that come with maintaining a TypeScript application of its complexity. gi is now able to bootstrap itself, but not a replacement I can trust (I used Opus 4.8 on it and am still paying that technical debt), so I’ve actually been considering shifting to Codex for most things and use pi solely through IPC mode, which would mean going back, full circle, to vibes.
After last week’s foray into the topic I tried (and failed) to enjoy some retro gaming this week (even though I did get a bit of a kick of further automating my Steam setup), but to compensate I took another pass at my NeXT and Mac JIT emulators, partly because I realised that (you guessed it) Opus lied and failed to implement MMU and I/O emulation correctly across the board.
I have another Radxa board to test, and this time I decided to have a go at doing photogrammetry to capture enough of the relative dimensions to design a 3D printed case for it–and besides the App Store being crammed with scammy “3D scanner” apps that do very little else despite repackaging SimpleObjectCapture (which, incidentally, you can now build for yourself in half an hour using Codex) I also confirmed iOS Object Capture is not really that great for fine detail, at least in the default settings:
The yet untested Q8B
I suspect I will be getting back to CAD and 3D printing pretty intensely over the next few months (or whenever I can actually move around). My back is still complaining, but at least I have an entire work week of… more sitting to… look forward(?) to, starting tomorrow.
Jun 14th 2026 · 5 min read
·
#3d-printing
#after-dark
#cydintosh
#esp32
#hardware
#mac
#retrocomputing
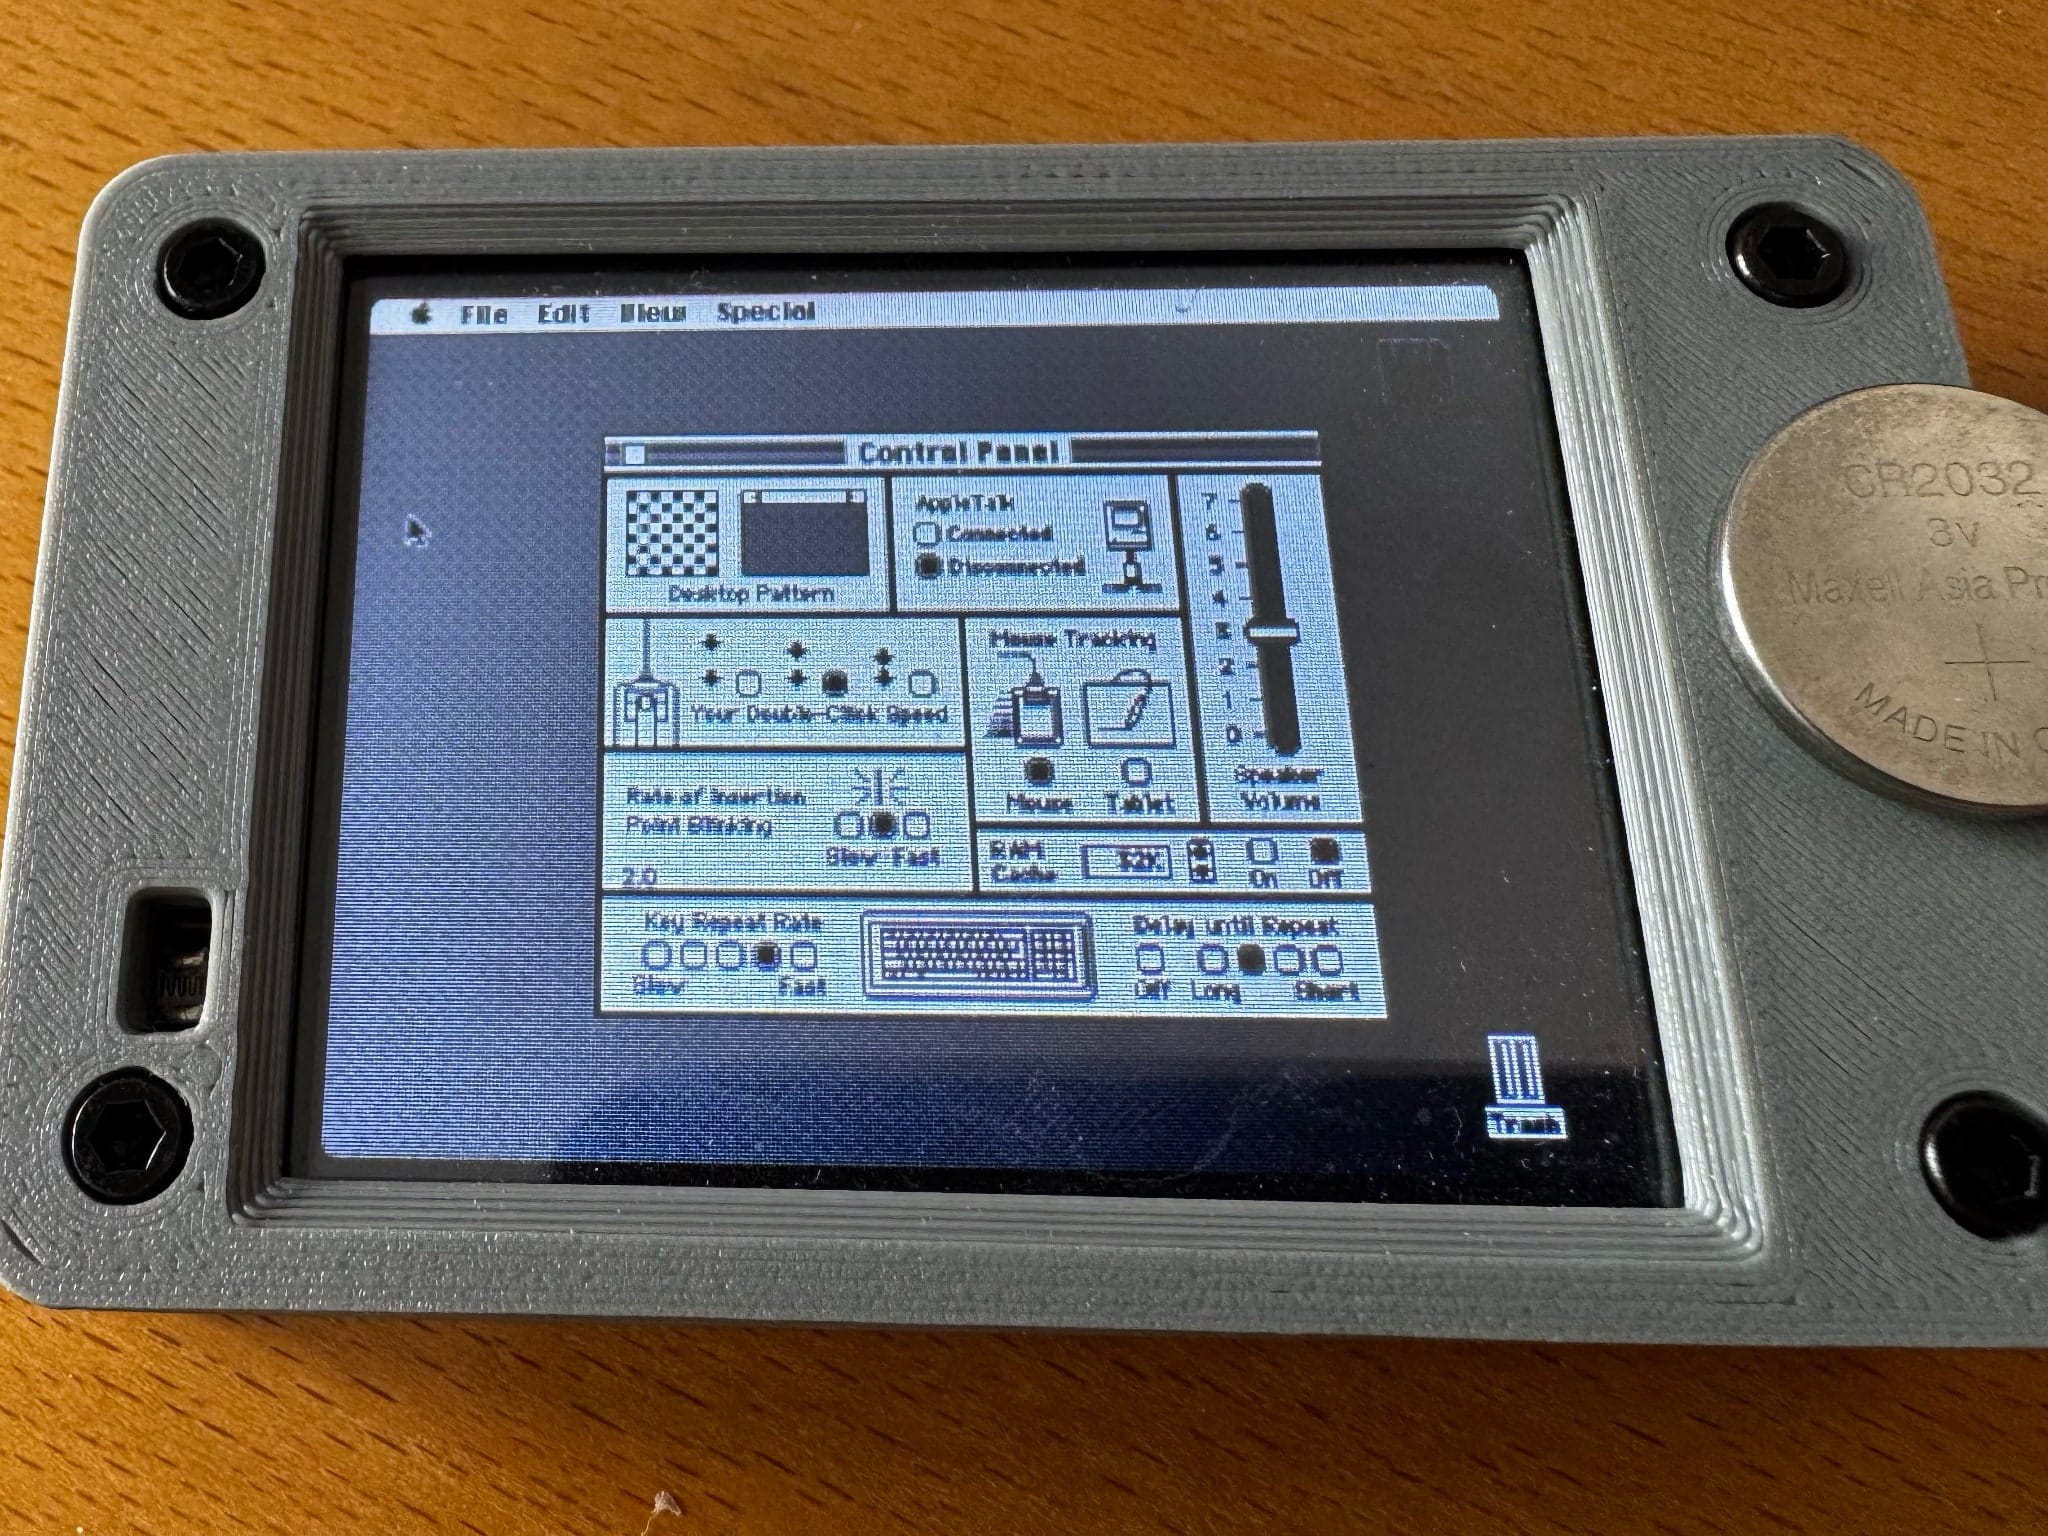
This is the (very) abridged story of how I got After Dark running on my own flavour of the Cydintosh–specifically, Flying Toasters on an ESP32-S3 board, zooming along at 65 FPS, which is both completely pointless and one of the more satisfying things I’ve done this month.
When I first got wind of the Cydintosh, I immediately dug out one of my Cheap Yellow Displays and tried to get the software running on it, only to find out two things:
My Cheap Yellow Display was (predictably) different (same 240×320, but an ESP32-D0WD)
The resistive touch screen mine had, together with the relatively small size, made it unusable in practice
I mean, it ran, but… Here, you be the judge:
Yes, that is a coin cell, and this is a bit contrived of an example
The photo above was me trying to push the envelope a bit.
The truth is that even with proper 1:1 pixel scaling, portrait rendering and some creative interpretations of how to push faster screen updates through the SPI bus, and even considering the Mac Plus emulation and basic Wi-Fi access worked really well (because of the genius trick of exposing ESP32 hardware through to the emulator), it was painfully slow.
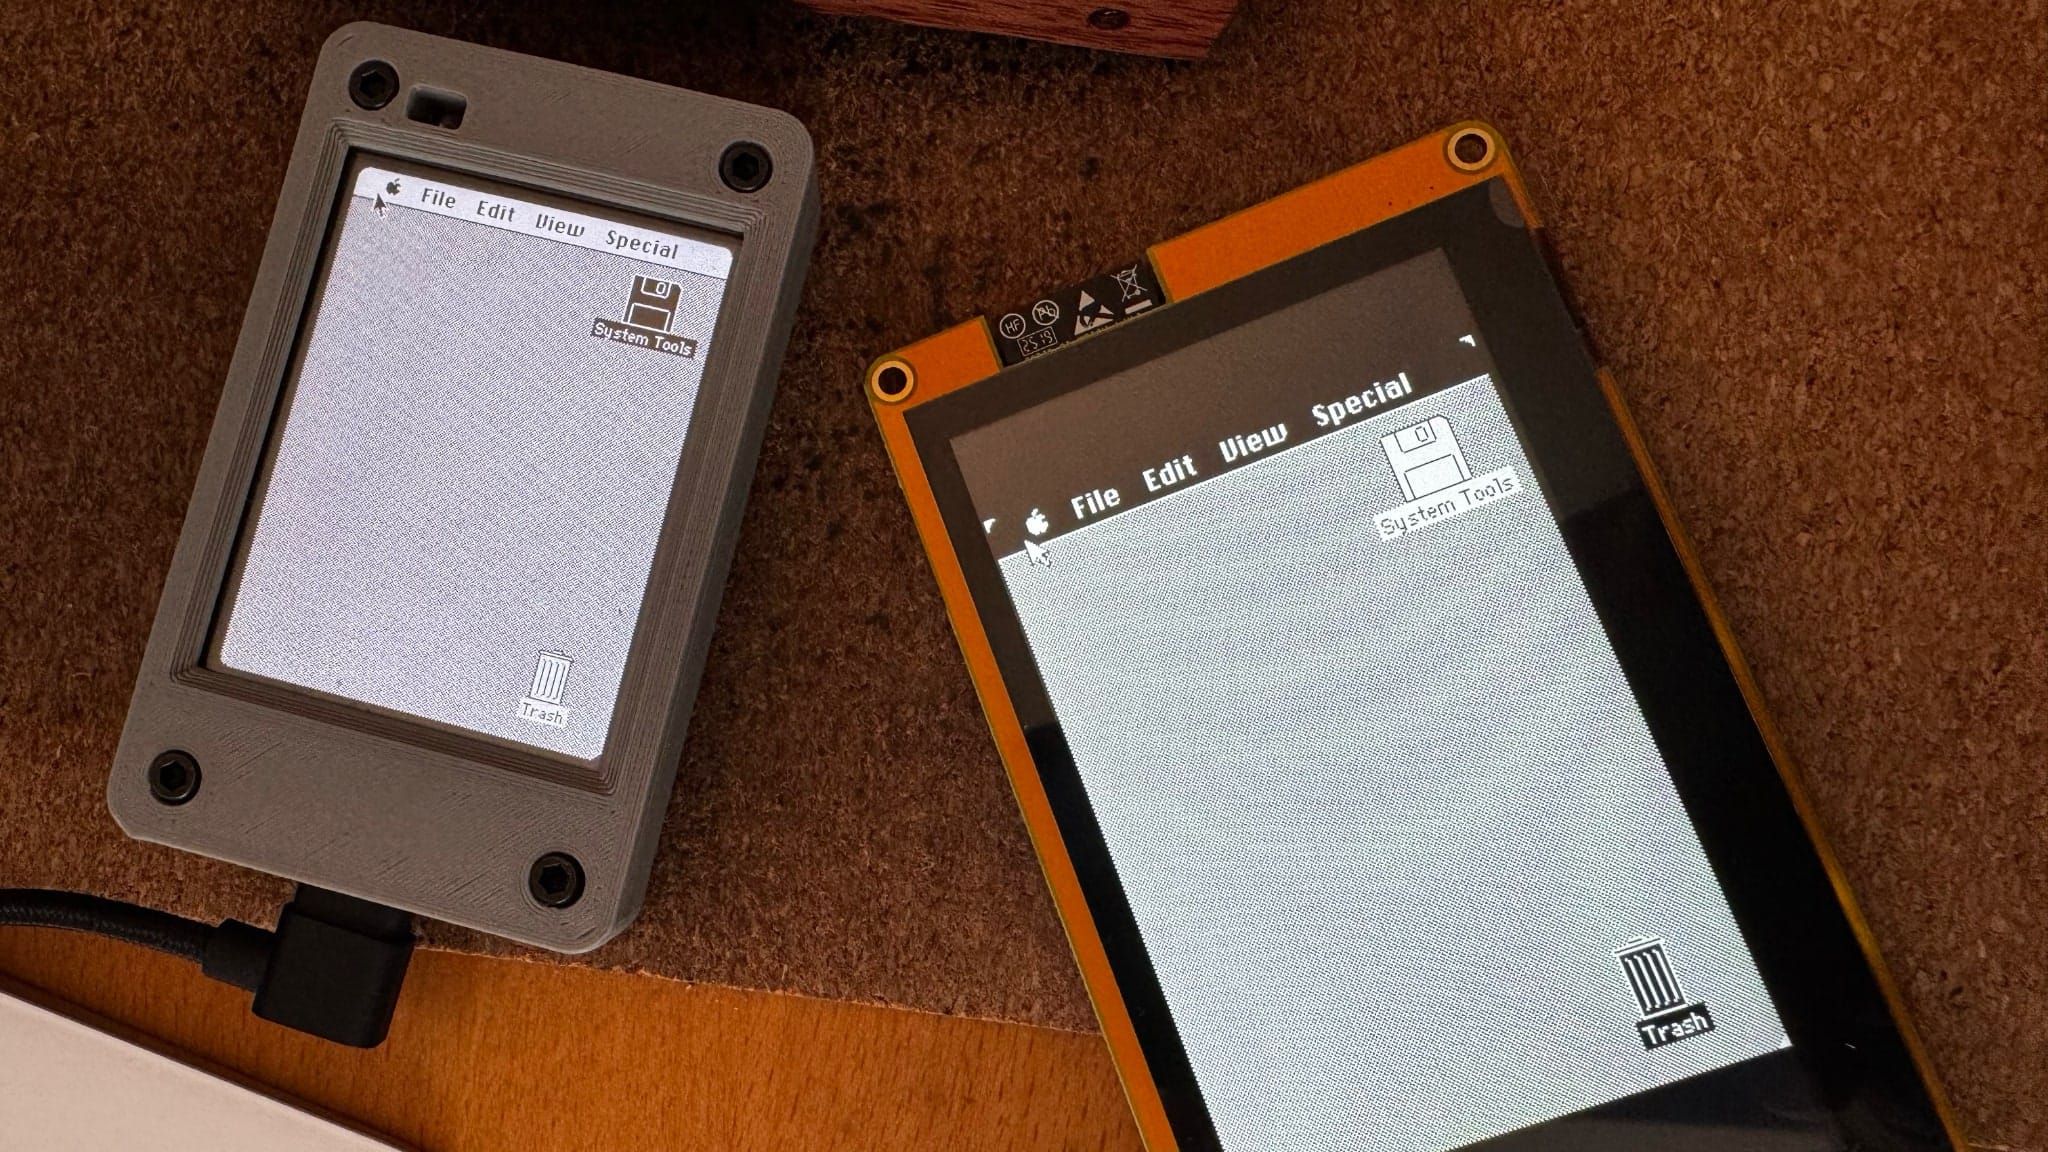
I did the obvious thing and ordered a couple more, larger displays with a slightly more powerful chip and proper capacitive screens:
Size comparison, still debugging display rendering
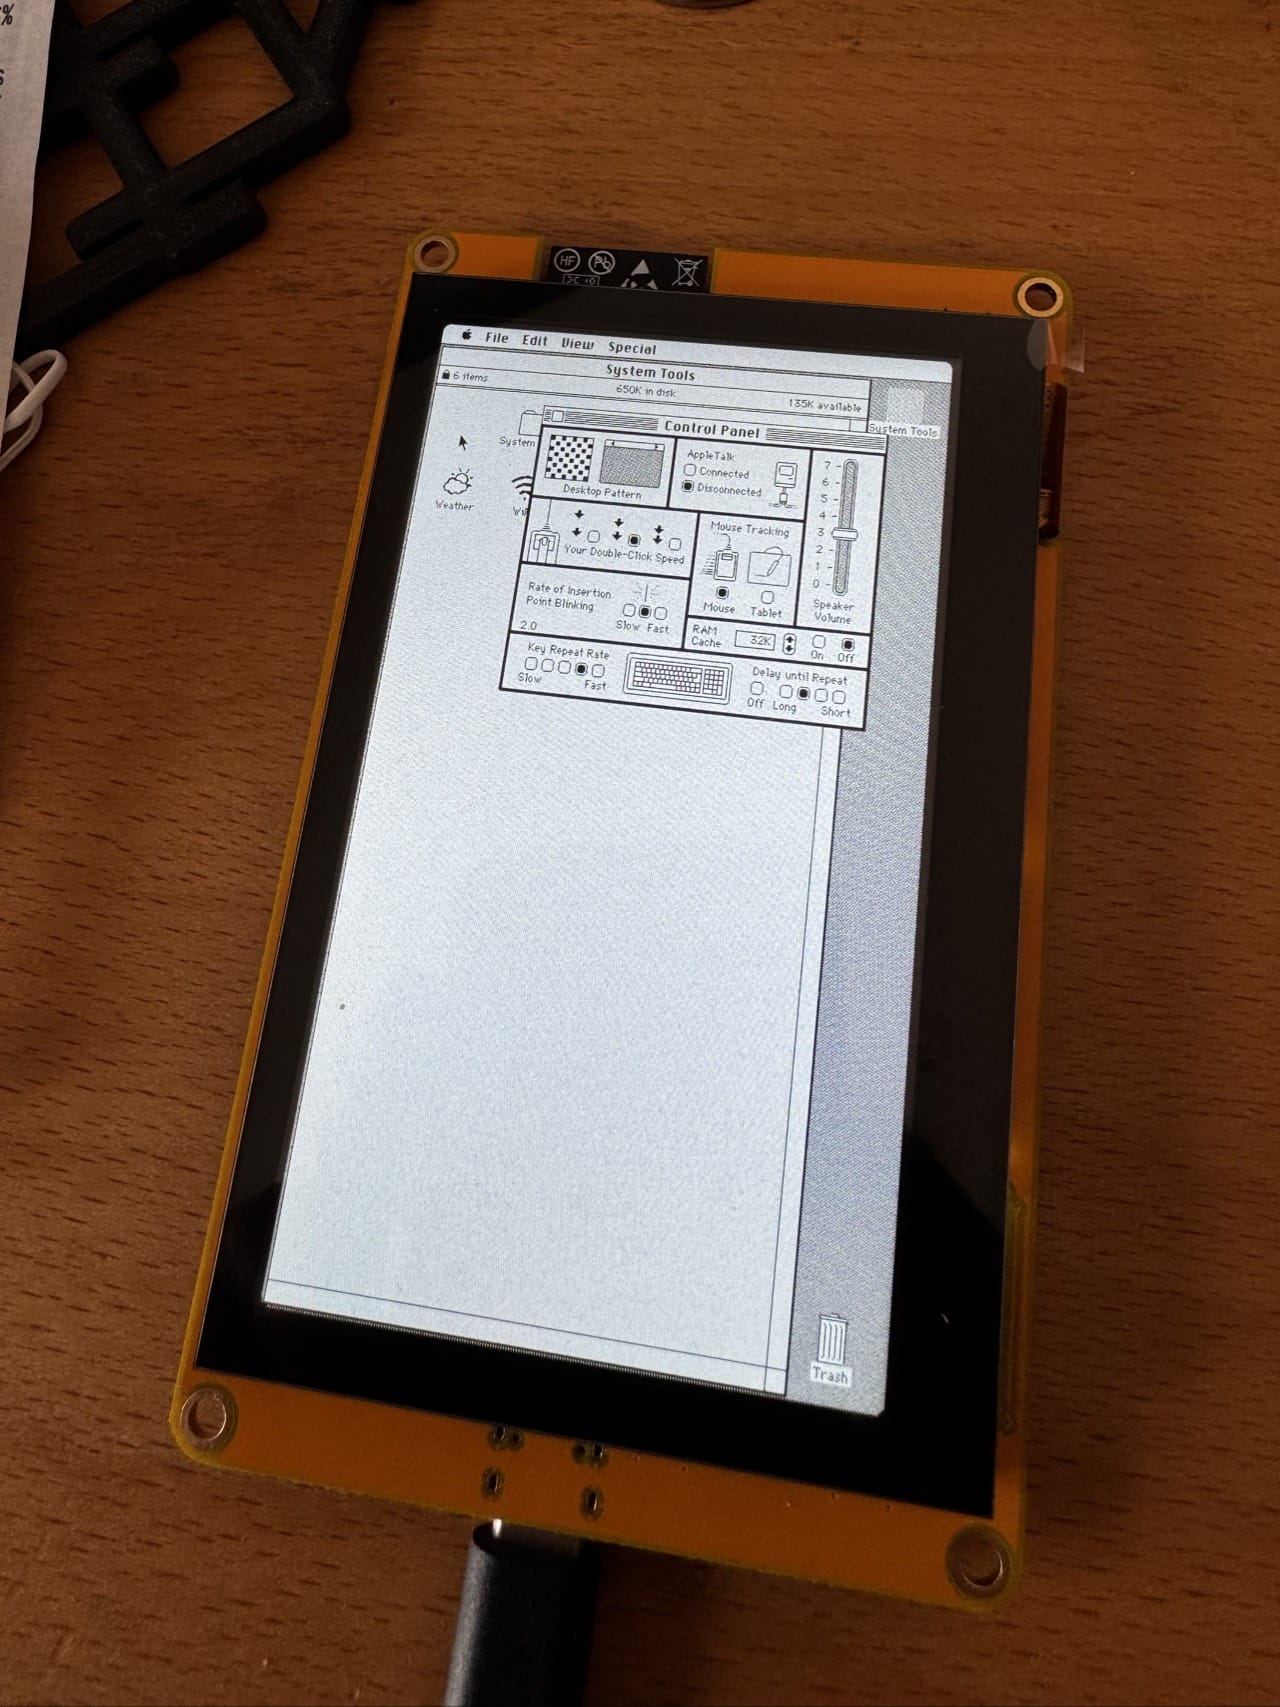
And the results were glorious: the new boards are labelled ESP32-8048S043C, and they come with an 800×480 capacitive panel, an ESP32-S3, and 8MB PSRAM, which is more than enough to run the emulator and a more complete version of Mac OS, running the original Musashi-based umac emulator at a fairly good speed (certainly faster than the original Mac Plus or even the Classic) and at full panel screen resolution (480×800) in black and white:
This reminded me a lot of my years doing PageMaker/print design
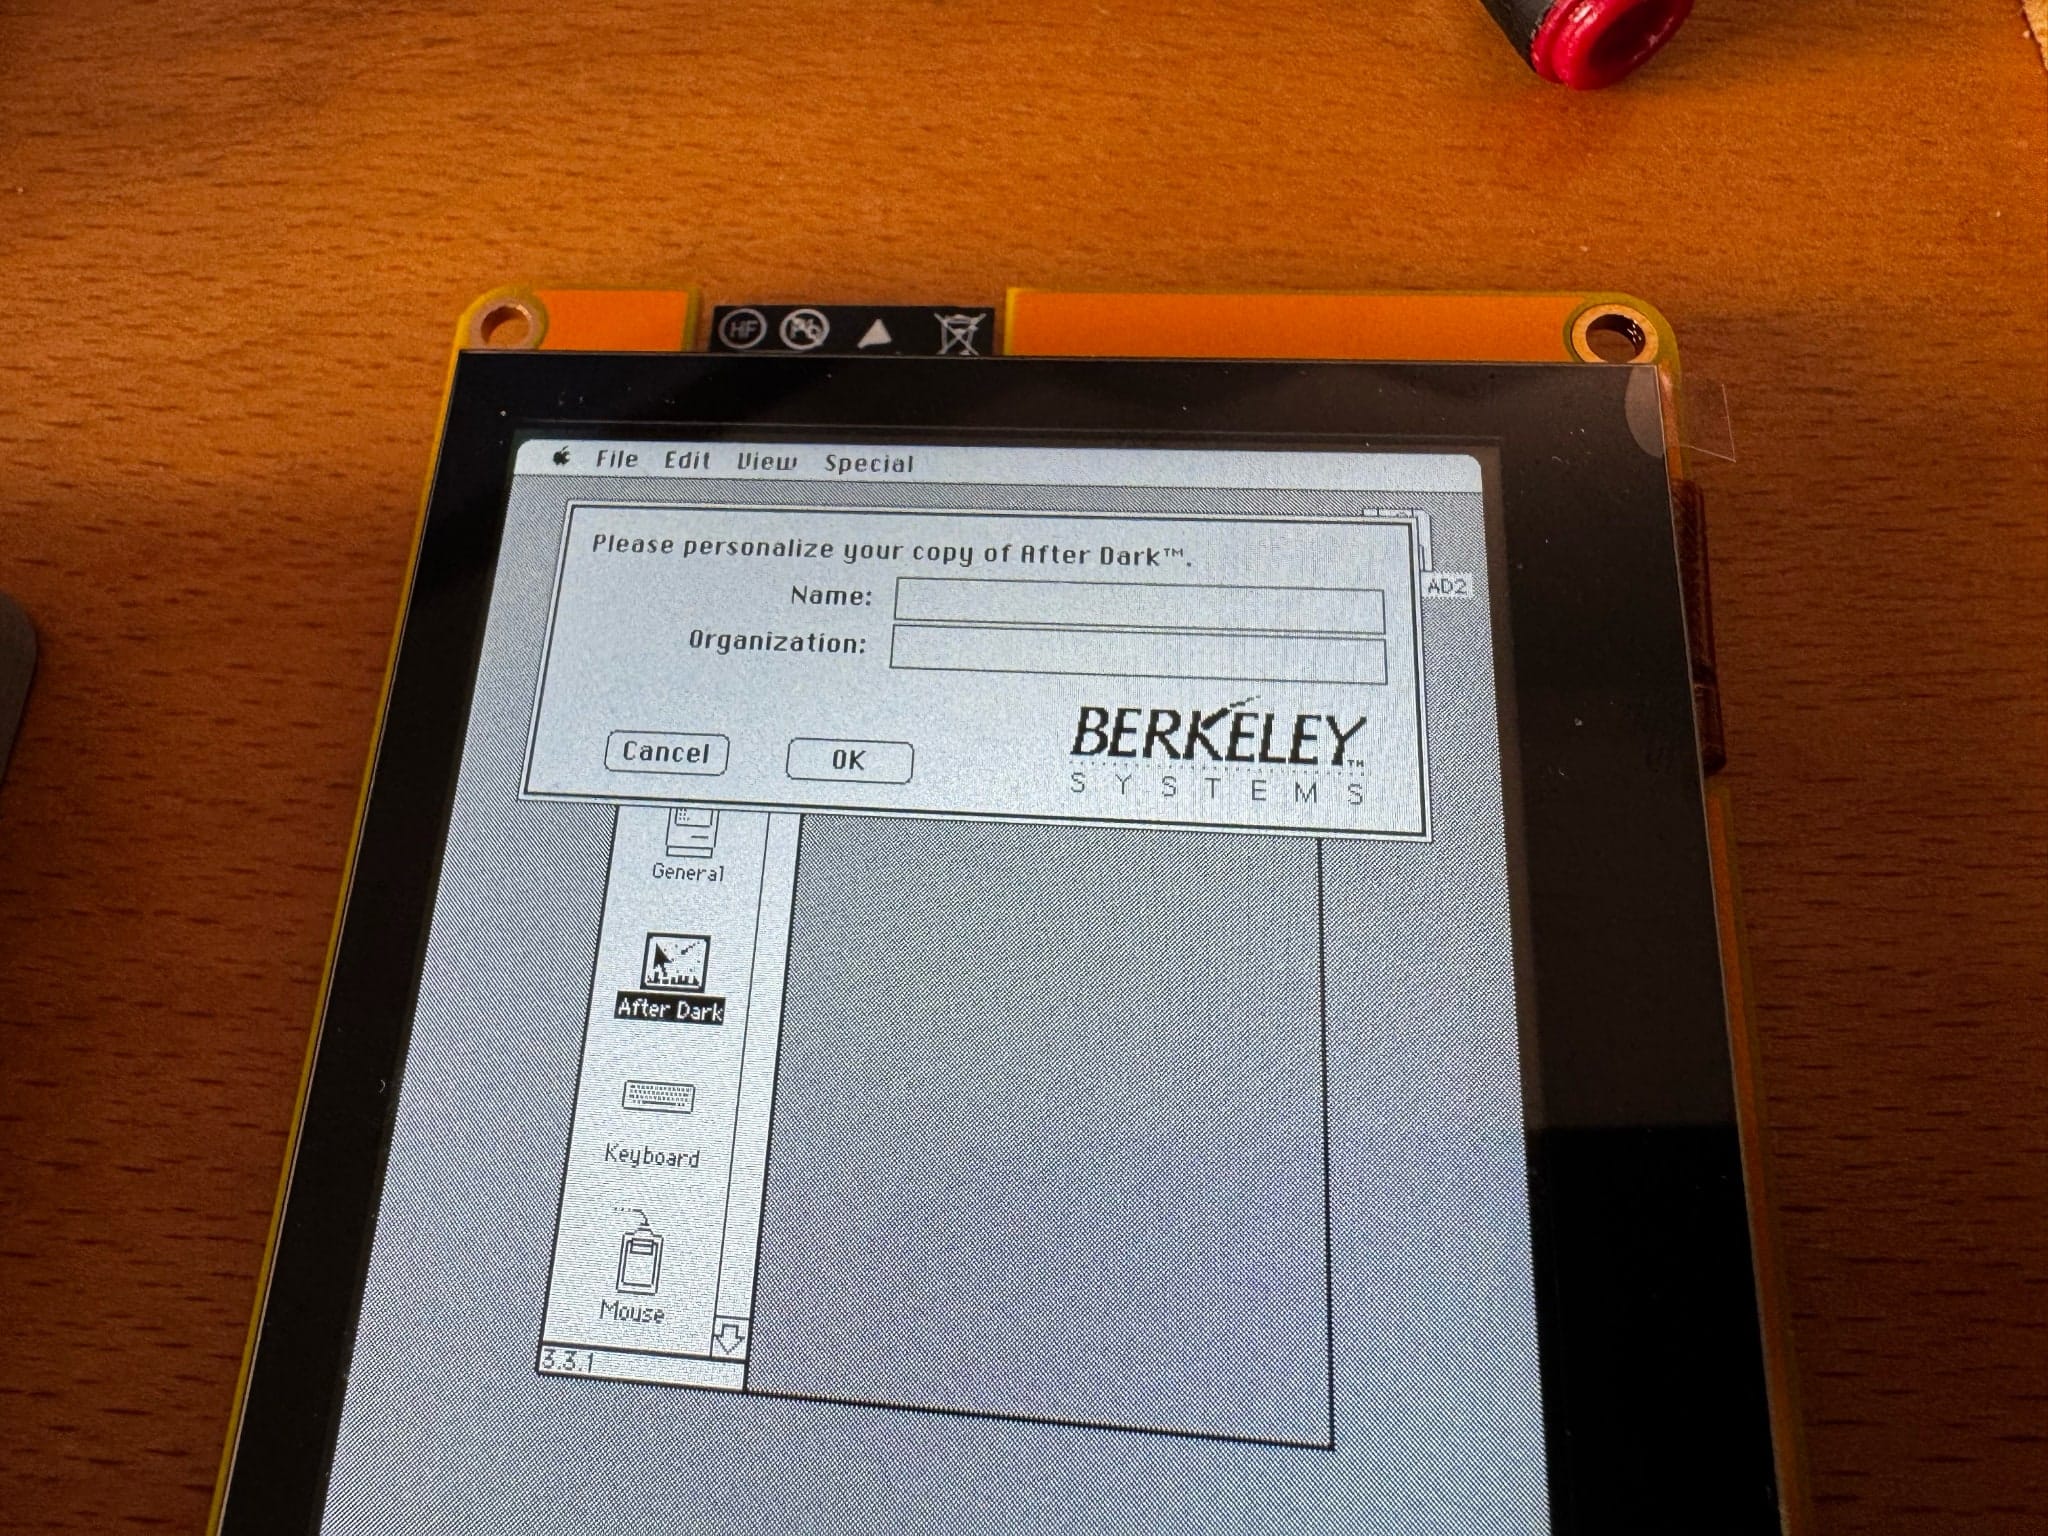
Everything went pretty swimmingly until I actually injected After Dark into the System folder:
Guess what, no keyboard. At all.
Without any way to input text (and no, Key Caps doesn’t really work for this), I had to resort to removing bits from the control panel with ResEdit until it mostly worked (removing the dialog was not trivial, and in the end I asked Codex to just disassemble the INIT(?) resource and skip over the dialog).
A few minor firmware tweaks later, I have a “real” Mac that runs After Dark as a screensaver perfectly:
Flying Toasters running on the ESP32-S3
In case you’re wondering, the toasters fly at a solid 65-67 FPS.
Which is faster than they ran on my actual Macintosh SE/30 back in 1991, because that machine was doing it in 1-bit black and white on a 68030 and this is a $15 display board doing it in 16-bit colour on a dual-core 240MHz chip with more RAM than my first three computers combined.
Not too shabby, even if it’s in black and white (which is what the original Mac ROM can handle).
And that is why I have gone down the rabbit hole of trying to port this to an LC ROM, on yet another ESP32 board (a P4). It turns out there’s not enough RAM on the other boards to hold a colour frame buffer, not enough bandwidth to do the delta refresh hacks I did in the original version, and not enough CPU power and storage for the required emulation and system changes…
I’m still grinding through the mechanics of paring down BasiliskII to fit, but in the meantime this board is sitting on my desk doing nothing but rendering endless toasters and reminding me some things are worth the sheer fun involved every time I glance at it.
Jun 11th 2026 · 22 min read
·
#ai
#hardware
#homelab
#linux
#reviews
#riscv
#sbc
#spacemit
This is a fascinating box–so much so that after almost three weeks playing with it, I amassed so much material that I nearly decided to split my review into two parts, but in the end I decided to condense it a bit and post a longer piece than usual, even if that means almost half of it is a fairly wide-ranging exploration of how to get AI workloads on it.
I decided to take a couple of days off and generally tune out, thanks to a few strategically placed bank holidays – which meant my usual mix of relaxing and dealing with a few chores.
Michael Tsai’s annual roundup of WWDC wish lists went up this week, and the thing that struck me most wasn’t any single request–it was the mood. There seem to be fewer wish lists than last year, several people openly admitted they couldn’t be bothered to write one, and the ones that did are pretty much bereft of any “aspirational” wishes.
Since today is a bank holiday for me, I decided to consolidate a few more of my notes into a post. What follows is a set of guiding “principles” that I’ve found useful over the past year or so and that I’ve codified into various bits of scaffolding I reuse across my projects.
After years of rumors, NVIDIA is finally shipping an Arm chip for Windows PCs, and the part that interests me isn’t the GPU–it’s the up to 128GB of unified LPDDR5x memory sitting behind it, something that Qualcomm never really went for.
The RTX Spark is essentially a consumer rebrand of the DGX Spark dev box (which I’ve been trying unsuccessfully to get my hands on, by the way), pairing a 20-core Grace CPU (co-designed with MediaTek, all big and “medium” cores, no efficiency cores) with up to 6,144 Blackwell cores, roughly a desktop RTX 5070’s worth of GPU inside an 80W envelope.
Might be a little toasty for a laptop, and will have to be very power efficient if they really want to compete with Apple Silicon… But there are zero actual specs anywhere on the PR, and pricing is sure to be… interesting.
But it’s nice to see them chasing the same unified-memory architecture that makes Apple’s M5 Pro/Max and the Framework Desktop genuinely useful for running local models, since 100GB+ of addressable VRAM is a lot more useful than the insulting 8-12GB you get on a discrete 5070.
And the gaming angle also makes it pretty interesting. Prism translation has finally gotten good enough that productivity work feels indistinguishable, but gaming remains a minefield of anti-cheat kernels that simply refuse to run. Qualcomm never “fixed” that (nor pricing, or efficiency either).
If it didn’t feel like the end times for computer hardware right now, this would be amazing.
May 31st 2026 · 3 min read
·
#go-pherence
#hardware
#networking
#niri
#notes
#weekly
Today I realised that I could just spend the day doing essentially nothing and that nobody would hold it against me (at least in Western nations), so… I might well do just that, with a few caveats:
Allergy season is finally fading (at least for me), but today was the first time I had to turn on the AC in the office, and it was great to realize that despite the recent Wi-Fi changes and almost four years of potential HomeKit foibles, my ESP32 hack is still working perfectly.
A few months after writing up the Cudy AX3000 units and moving the house over to OpenWRT, I ended up revisiting the one bit I had deliberately waved away as “good enough”: roaming.
My sinuses are still giving me grief, but this week was much more successful at pretending to be enjoyable, at least. For starters, we watched Project Hail Mary, and it was every bit as good as I would expect it to be, which is very rare in movies these days.
I think it’s time for an update on my iPad Pro M1 and, most importantly, the Logitech Combo Touch I got for it. Think of it as a long term review of sorts.
This is a little bit of follow-up to my MiniBook X review – I keep using it routinely (especially when we travel for leisure) and love the little thing to bits, but I’ve been wanting to run it mostly on power saving mode to reap the most benefit out of the hardware (and battery, of course), so I started looking at desktop environment alternatives.
Yes, I could already get a full afternoon (and then some) out of it, but Apple Silicon has spoiled me as far as battery life expectations go, and GNOME has a little bit too much baggage for that kind of extended use.
Since I spend 90% of my time on it writing or coding and still have a penchant for keyboard-driven desktops, I initially switched to Fedora Sway Atomic (gotta love being able to swap environments with a single command…), but later installed Niri and Noctalia Shell because I really like both the idea of a scrolling window environment and the sheer polish of the whole thing–even if there are some rough edges here and there.
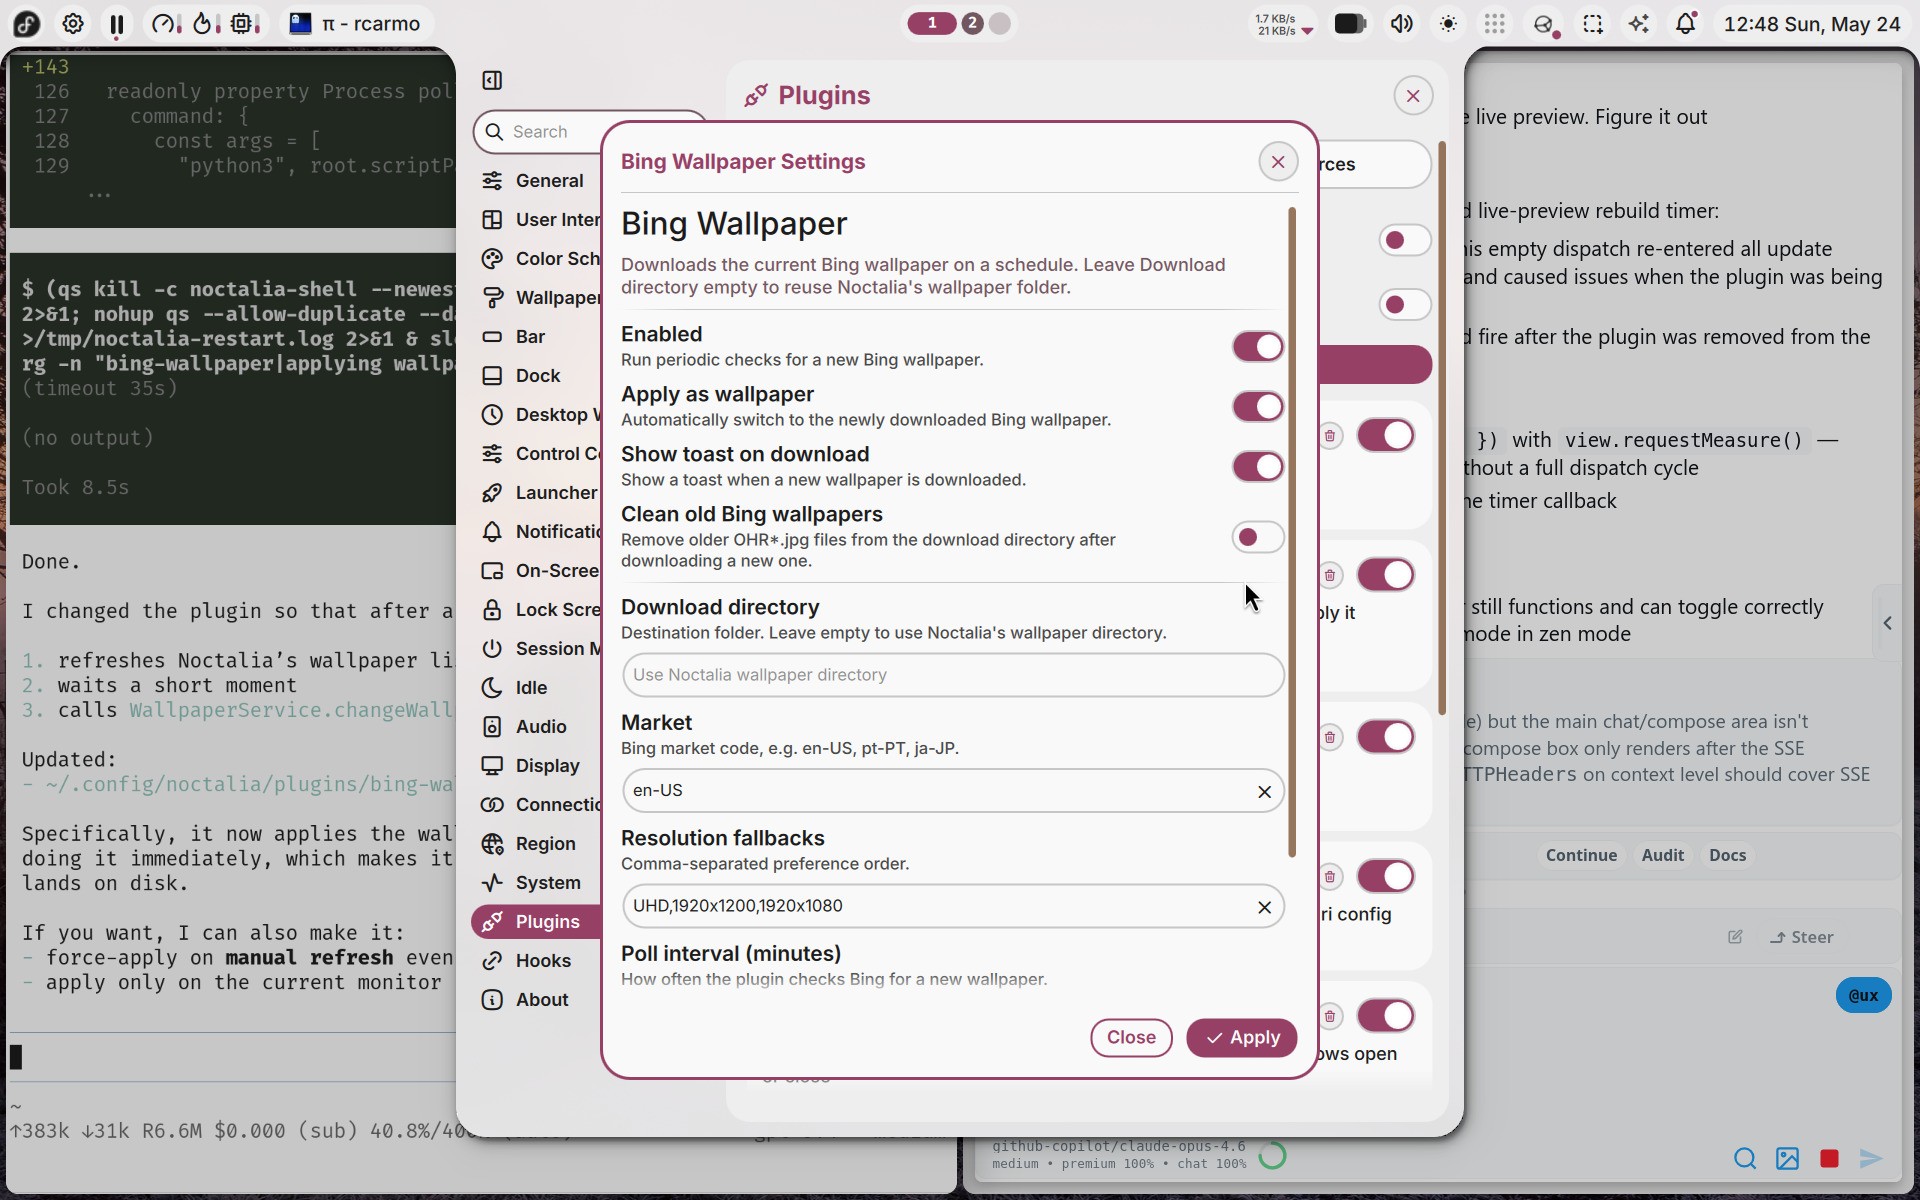
I am very happy with it, and writing plugins for it is trivial:
I hacked together a Bing Wallpaper plugin in 30m
The one thing that annoyed me to no end, though, was locking on suspend, which Noctalia Shell should do but apparently doesn’t in Fedora, so I had to resort to two hacks:
This last one feels extremely gauche and I hope to find a better way, but I guess this comes with the territory. I don’t really care about having a trendy Wayland desktop (I just want a dead simple one with a bit of polish), but I hope this kind of hacks won’t be necessary for much longer.
Oh, and of course I set gsettings set org.gnome.desktop.wm.preferences button-layout 'close,minimize,maximize:appmenu' to match macOS decorations.
I know this blog has strayed a fair distance from its Mac-centric origins, but I’ve been keeping a mental list of all the things that are broken, missing or inexplicably neglected in Apple’s software, and it’s gotten long enough that writing it down feels like a public service1.
The weather has gone a tad cloudy again, which provided me some relief from my allergies–but not enough for proper overnight rest, so yet again I arrived at Friday afternoon totally exhausted.
Last weekend my DS1019+ decided, for some unfathomable reason, to stop working after I took it out of the closet, dusted it and put it back, and I have feelings about it.
The Ternus announcement got me thinking about the one thing I keep wishing Apple would build and almost certainly never will: a family-scoped AI assistant that actually works across all our devices.
 Rui Carmo