 Rui Carmo
This was a long one–I spent a fair bit of time with the Orange Pi 6 Plus over the past few months, and what I expected to be a quick look at another fast ARM board turned into one of those test runs where the hardware looks promising on paper, the software is wonky in exactly the wrong places, and you end up diving far more into boot chains, vendor GPU blobs and inference runtimes than you ever intended.
Unlike most of the ARM boards I’ve reviewed until now, this one is not an RK3588 board: The Orange Pi 6 Plus uses the CIX P1 (CD8180/CD8160), with 12 CPU cores, a Mali G720 GPU, a dedicated NPU and a wild set of specs for the form factor. Boards like this promise everything at once–homelab, edge AI, dual 5GbE, low power–but they only matter if the software gets out of the way.
Disclaimer: Orange Pi supplied me with a 6 Plus free of charge, and, as usual, this article follows my review policy.
And, for a change, I decided to make sure the software did exactly that, and made it my concern from the start–i.e., I built my own OS images for it (a fork of orangepi-build) and went in a bit deeper than usual, spending around two months taking notes, benchmark logs and even Graphite telemetry as I went along.
Hardware
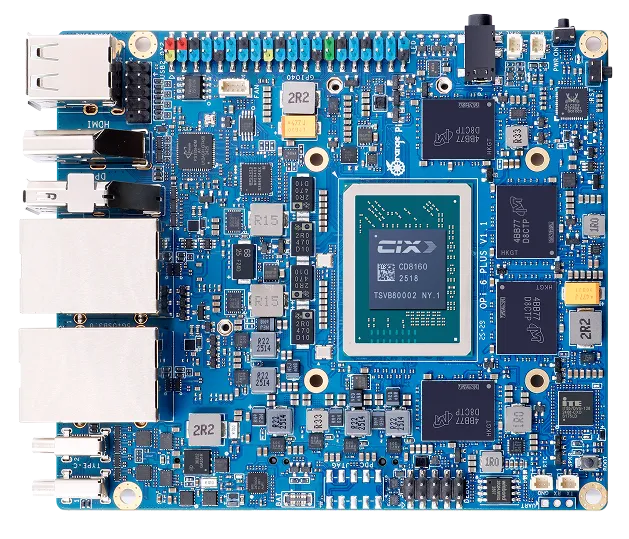
One of the reasons I wanted to test this board is that the SoC is the CIX P1, which Orange Pi bills as a 12-core part with a combined 45 TOPS across CPU, GPU and NPU. The machine I tested came with:
- CIX P1 (CD8180/CD8160), 4×Cortex-A520 plus 8×Cortex-A720 cores
- 16GiB of RAM (roughly 14GiB visible to Linux)
- dual Realtek RTL8126 5GbE
- Realtek RTL8852BE Wi-Fi and Bluetooth card
- Mali G720 / Immortalis-class GPU
- A three-core Zhouyi NPU
And if you’ve been paying attention to all my homelab testing, those two 5GbE ports alone make this more interesting than most hobbyist SBCs. But, of course, there is a lot more to expandability than that:
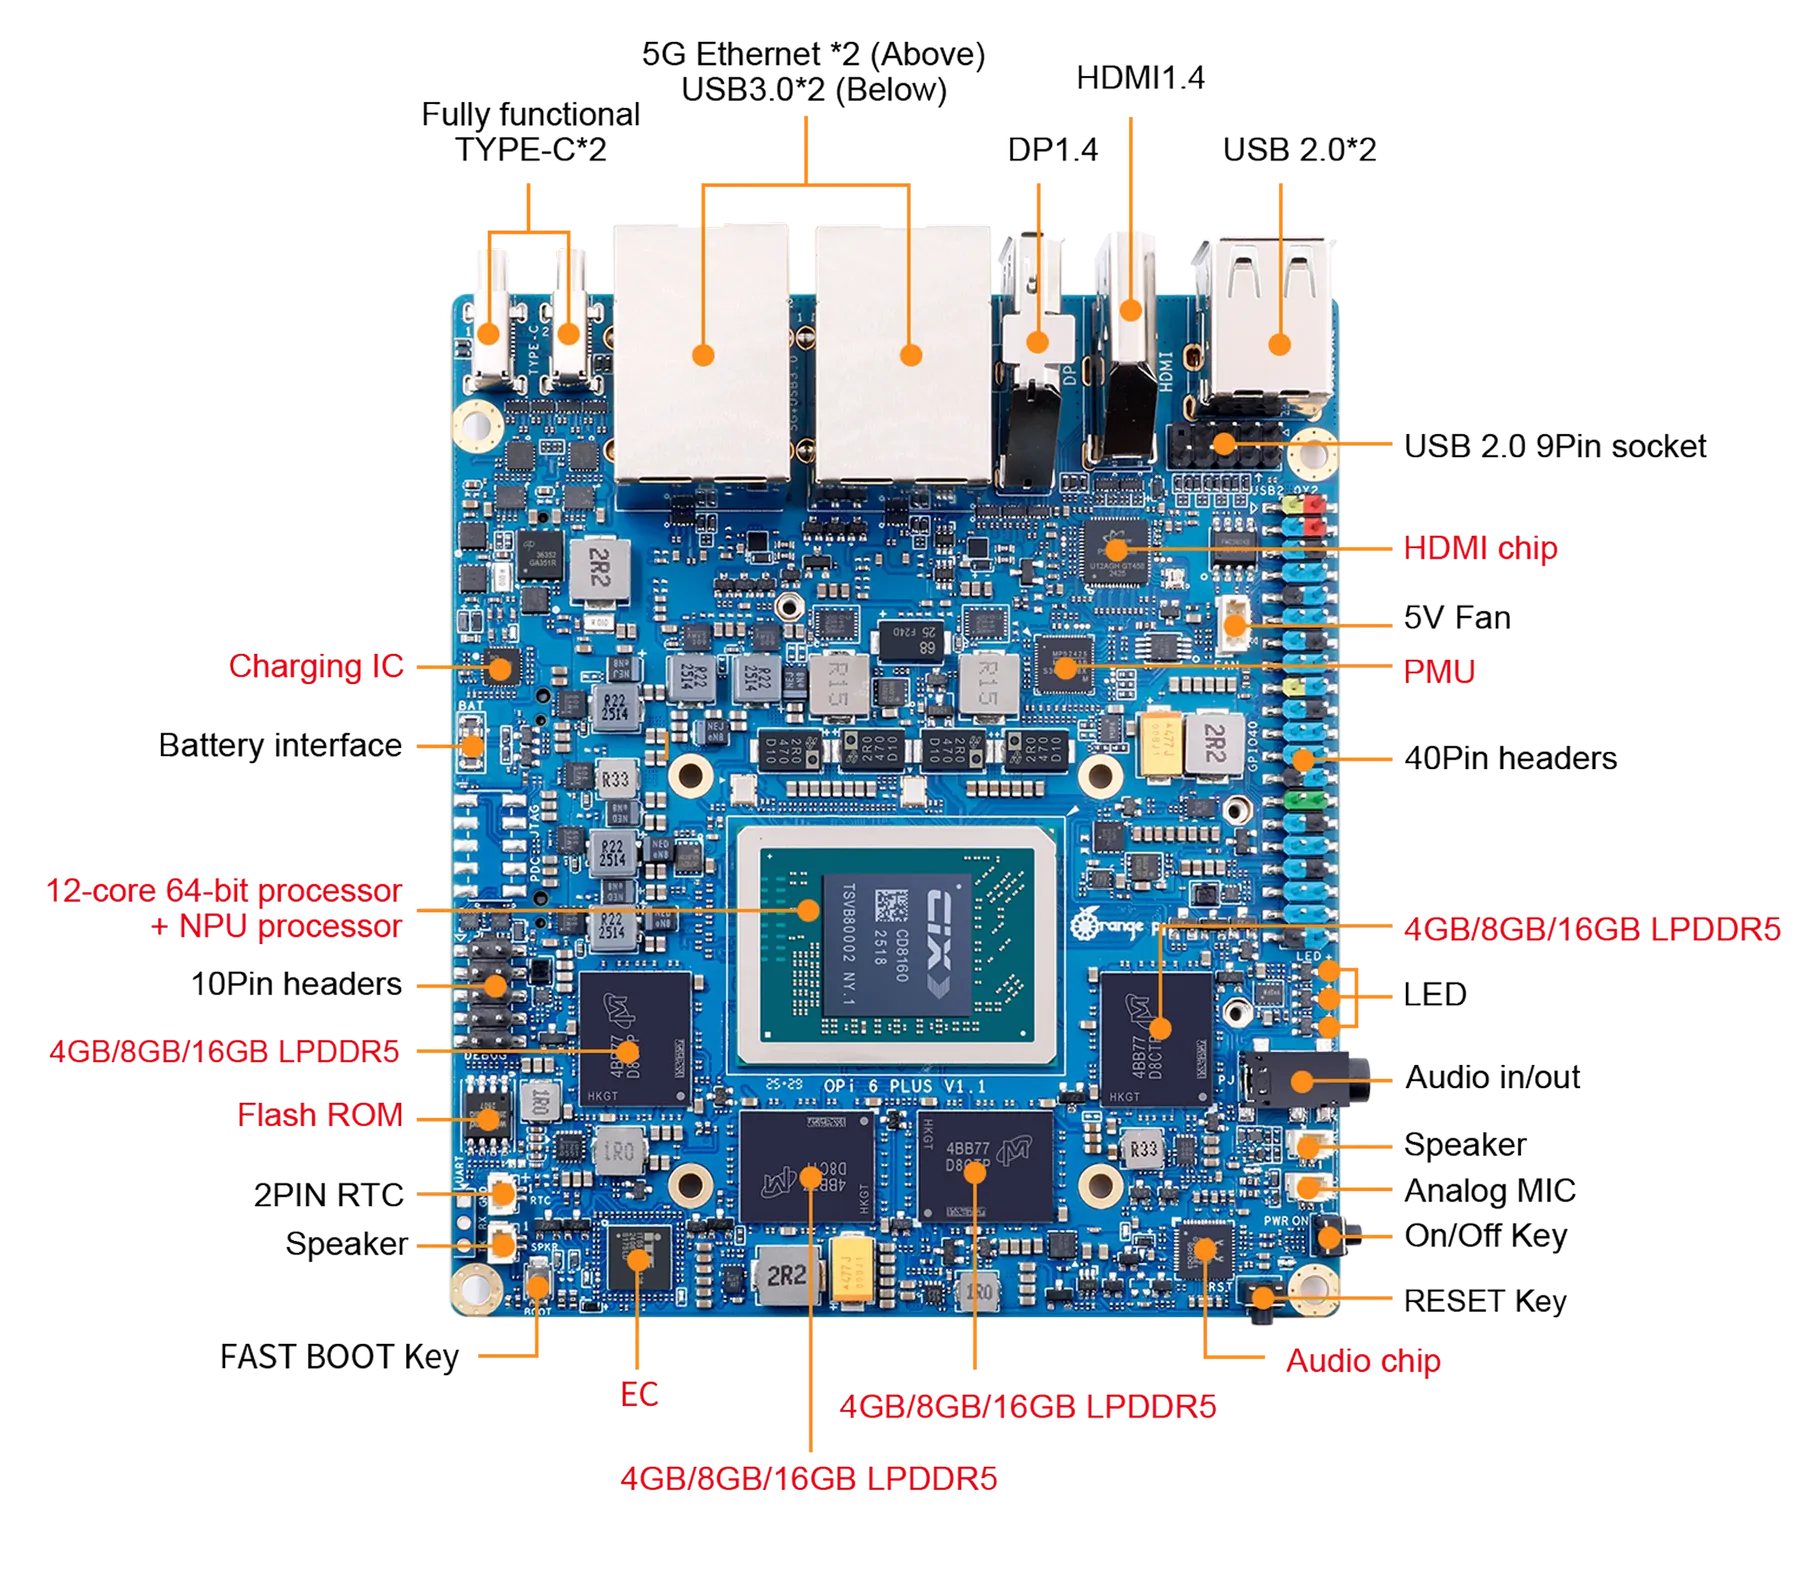
Hardware Info
The CPU is interesting in itself–the fastest A720 cluster reaches about 2.6GHz, the A520s top out around 1.8GHz, so like many other big.LITTLE ARM architectures you get asymmetric clusters rather than a uniform twelve-core machine:
Architecture:                         aarch64
CPU op-mode(s):                       64-bit
Byte Order:                           Little Endian
CPU(s):                               12
On-line CPU(s) list:                  0-11
Vendor ID:                            ARM
Model name:                           Cortex-A520
Core(s) per socket:                   4
CPU max MHz:                          1799.9980
CPU min MHz:                          799.9990
...
Model name:                           Cortex-A720
Core(s) per socket:                   8
CPU max MHz:                          2600.1980
CPU min MHz:                          799.8400
lspci is a bit more revealing, especially because you get to see where the dual 5GbE setup and Wi-Fi controller are placed–each seems to get its own PCI bridge:
0000:60:00.0 PCI bridge: CIX Technology Group Co., Ltd. CIX P1 CD8180 PCI Express Root Port
0000:61:00.0 Ethernet controller: Realtek Semiconductor Co., Ltd. RTL8126 5GbE Controller
0001:30:00.0 PCI bridge: CIX Technology Group Co., Ltd. CIX P1 CD8180 PCI Express Root Port
0001:31:00.0 Ethernet controller: Realtek Semiconductor Co., Ltd. RTL8126 5GbE Controller
0002:00:00.0 PCI bridge: CIX Technology Group Co., Ltd. CIX P1 CD8180 PCI Express Root Port
0002:01:00.0 Network controller: Realtek Semiconductor Co., Ltd. RTL8852BE PCIe 802.11ax Wireless Network Controller
In the same way, the USB bus is entirely ordinary (this is with it plugged into one of my KVMs):
Bus 007 Device 002: ID 05e3:0610 Genesys Logic, Inc. Hub
Bus 007 Device 005: ID 04d9:0006 Holtek Semiconductor, Inc. Wired Keyboard (78/79 key) [RPI Wired Keyboard 5]
Bus 007 Device 006: ID 093a:2510 Pixart Imaging, Inc. Optical Mouse
Bus 011 Device 002: ID 05e3:0761 Genesys Logic, Inc. Genesys Mass Storage Device
Bus 012 Device 002: ID 0bda:b85b Realtek Semiconductor Corp. Bluetooth Radio
Nothing exotic, which I rather like. And, by the way, the board ships with Cix Technology Group UEFI, version 1.3, so setting up boot devices and managing (very) basic settings was trivial.
Building the Image
This is where I took a very large detour from my usual approach: I decided early on that I wasn’t going to use a vendor image for this board.
Vendor images for SBCs like this always tend to be good enough to boot, occasionally good enough to do basic benchmarks, and almost never something I want to build on–especially if I’m doing local AI work, host-native services, or anything that requires me to trust package sources, first-boot behaviour and upgrade paths.
I wanted a server-first layout, reproducible fixes and a place to bake in GPU/NPU prerequisites, so I forked orangepi-build and started from there, with a fairly high bar:
- I wanted a fully reproducible Debian 13 / Trixie build with features like
/dev/kvmpresent, not a vendor image with stale software and missing features I wanted. - The build needed to stop treating Ubuntu as the only real target–
add-apt-repository, PPA logic andsoftware-properties-commonhad to be cleaned out. - Boot fixes had to be baked in from the start, not applied as post-flash rituals.
- First boot had to be deterministic. If the root filesystem resize requires me nearby with serial and patience, the image isn’t finished.
- I needed a clean place to stage GPU firmware, vendor userspace and NPU packages.
The Orange Pi repository included kernel 6.6.89-cix, so a lot of the above was already “there”–I just needed to hack at it, but instead of doing it entirely by hand I got piclaw to set things up on an Ubuntu 22.04 VM.
Over a few weeks (this took a while), the above list translated into a fairly concrete set of changes in the build tree:
- added Trixie configs under
external/config/{cli,desktop,distributions}/trixie - patched
scripts/distributions.shfor Debian 13 support - fixed the board config to allow
trixieunderDISTRIB_TYPE_NEXT - removed Ubuntu-only dependencies from the package lists
- forced standard Debian mirrors
- made the kernel build non-interactive
- started baking in GPU/NPU prerequisites and development tooling for later testing
The package side needed archaeological work too. I patched orangepi-config to stop behaving as though it were on Ubuntu, removed software-properties-common from the Trixie dependency chain, forced regeneration of cached packages, and went hunting through component_cix-next for whatever vendor bits still existed and matched my kernel, taking notes throughout.
Getting To First Boot
My first boot-related note on this board was short: I flashed my custom Trixie image, got as far as GRUB, and it fell over because the EFI stub was wrong. The image did contain the right DTBs (SKY1-ORANGEPI-6-PLUS.DTB and friends), but the build scripts somehow commented out useful menu entries and the default pointed at the ACPI path.
But getting past GRUB was only half the battle. The first real boot surfaced another annoying issue: the partition resize worked, the root filesystem resize didn’t, and the machine failed to reboot cleanly at the handoff. I had piclaw trace the resize helper, found it was disabling itself before the second stage could run, and patched that too.
The whole thing made for a pretty intensive couple of weeks:

In parallel, I made sure to include GPU/NPU support:
- firmware symlink so
panthorcould findmali_csffw.bin - baked in
cix-noe-umdandcix-npu-onnxruntime - and a big pile of dev tooling so the board could bootstrap AI experiments without turning into a scavenger hunt
NVMe and Swap
Once the image was booting reliably, I wanted the board off SD entirely. I had a 512GB NVMe drive sitting about, so I had piclaw handle the migration–even though it had just finished patching orangepi-config, the actual cutover was done manually: partition the NVMe into EFI, root and swap, rsync everything across, patch GRUB.CFG to point at the new PARTUUID, reboot, verify, remove the SD card.

Software
So, to recap, I had to fix these things for my custom image:
- Boot chain: initially broken because GRUB defaulted to the wrong path; stable once DTB boot was forced
- GPU / Vulkan: initially
llvmpipefallback or panvk failure; working with vendor Vulkan ICD onmali_kbase - OpenCL: not useful at first, functional once the vendor userspace was in place
- NPU kernel side: visible from the beginning, probe messages reporting three cores
- NPU userspace: present only in fragments, inconsistent package references, a lot of manual validation needed
But after the first few steps were done, I had zero issues installing or building software on this–GCC 14.2 from Trixie, Bun as the primary scripting runtime, and the usual complement of build-essential, cmake, clang and ninja for C/C++ projects.
Python 3 and pip are present for the inevitable bits that still need them, and Docker runs cleanly, plus I made sure I had /dev/kvm available for virtualised workloads–and with the CIX patches for the P1 SoC, everything went swimmingly. The kernel is PREEMPT-enabled, which is pleasant for interactive work and inference latency, though I haven’t tested RT workloads.
I even got Proxmox to run reliably on this with zero issues (including creating ARM VMs on it) before wiping the NVMe to do some AI testing.
The one area where the software story gets awkward is the vendor-specific GPU and NPU userspace–covered in the next two sections. Everything else about running Debian on this board is unremarkable, which is a compliment.
GPU
Out of the box, the Linux graphics story was absent. The kernel side was in a half-state that looked superficially encouraging–/dev/dri/* present, both panthor and mali_kbase around, the system clearly aware of a Mali GPU, etc.
But Vulkan fell back to llvmpipe, and forcing the Mesa Panfrost ICD produced Unknown gpu_id (0xc870) errors. So I had piclaw go through the Orange Pi and component_cix-next package sources and find the missing pieces: vendor userspace for the CIX stack–cix-gpu-umd, cix-libglvnd, cix-libdrm, cix-mesa and a Vulkan ICD pointing at libmali.so.
Installing those got me partway–the userspace reported No mali devices found, because the board was still on the wrong kernel path. Once I rebound the GPU from panthor to the vendor mali/mali_kbase stack, /dev/mali0 appeared and Vulkan reported actual hardware:
deviceName = Mali-G720-ImmortalisdriverID = DRIVER_ID_ARM_PROPRIETARY
OpenCL also came up correctly afterwards, again via the vendor path.
This was pretty good news as far as typical SBC testing goes, since it means you can get decent (if vendor-specific) GPU support working–but getting there involved driver rebinding, vendor package archaeology and a persistent module policy to keep the machine on the right stack across reboots.

NPU
The NPU story was, if anything, even more typical of this class of hardware.
Linux clearly knew there was an NPU–dmesg reported three cores during probe–but the userspace was absent or incomplete and the package references inconsistent enough that I had to validate URLs by hand. One package version was simply gone, another worked, and I only reached a coherent install because component_cix-next still had enough usable artifacts lying about.
Not to say the NPU is fake or useless–it isn’t. But the tooling has that familiar feeling of being assembled by several teams who weren’t speaking to each other as often as they ought–and if your interest in a board like this is local AI, that matters more than any TOPS figure on a product page.

Performance
This is where the board started being interesting.
Since I have been getting more and more involved in low level AI work, I spent most of my time testing local inference–the Orange Pi 6 Plus is not a universally good AI box, but it is surprisingly usable within a narrow envelope of models and runtimes.
And to make it usable for a few use cases, I needed a model-and-runtime combination that felt like an actual working stack rather than a demo. I ended up trying four inference runtimes–[PowerInfer], [ik_llama][ikl] (which is a CPU-optimized version of llama.cpp), vanilla llama.cpp, and my own Vulkan-patched version of llama.cpp that for the Orange Pi 6 Plus’s GPU (the NPU, alas, like many other ARM SoC NPUs, is designed more for vision processing than LLM work, and I spent a few evenings trying).
I ended up running well over a dozen different combinations of models and runtimes, and these five were the ones I invested the most time in, since I wanted a model that was powerful enough for “production” use even if it was a little slow in practice:

The dark bars are generation speed, the lighter bars are prompt processing. The verdicts on the right reflect what happened when I pushed each model through a real agent pipeline with tool calls, not just a short benchmark prompt–and that is where the gap between “fast on paper” and “actually works” showed up.
The Liquid models posted impressive raw tok/s figures but broke down in practice with blank responses and formatting failures. The 35B sparse model was surprisingly fast under ik_llama.cpp but ate all available RAM and failed roughly 40% of the time.
Only the Qwen 4B on Vulkan held up as something I would actually leave running and the best all-round result was Qwen3.5 4B Q4_K_M on Vulkan:
| Metric | Value |
|---|---|
| Runtime | llama.cpp Vulkan |
| Prompt t/s | 8.4 |
| Generation t/s | 9.7 |
| Typical response time | 6-25s |
| RSS | ~5.3GB |
| Stability | 10/10 pass at -ub 8 |
Not desktop-GPU territory, but enough to move the board from “cute” to “useful”. More importantly, it was stable–it followed my coding assistant’s AGENTS.md prompt correctly, handled tool calls, and didn’t chew through all available memory.
The production configuration I eventually settled on was:
llama.cpp -m qwen3.5-4b-q4_k_m.bin \
  -c 32768 \
  -ngl 99 \
  -ub 8 \
  -np 1 \
  --reasoning-budget 0 \
  --jinja \
  --cache-ram 0
Every flag has a story–especially (-ub), the micro-batch size, which controls how many tokens llama.cpp tries to process per Vulkan dispatch.
It turns out that the Mali Vulkan backend had a descriptor-set exhaustion issue that needed patching upstream before it stopped crashing (yes, I spent a while debugging Vulkan…), and I ran a set of benchmarks specifically for that:

Bigger batches should mean better GPU utilisation and faster prompt ingestion, but the Mali G720’s Vulkan driver has a hard limit on descriptor sets–exceed it and the backend either crashes or silently degrades.
The green bars are stable configurations, the orange ones are not–and the dashed box marks where I landed for production. At -ub 16, prompt speed collapsed because the driver was already struggling; at 64+ it fell over entirely.
The tuning sweep showed where the practical ceiling was rather than the theoretical one:
- At
-ub 2, the setup was stable but underwhelming: about4.3prompt tok/s and9.7generation tok/s. - At
-ub 4, prompt speed improved to5.9tok/s with the same9.7generation rate. - At
-ub 8, which is where I eventually landed, prompt speed climbed to8.4tok/s and generation stayed at9.7tok/s. - At
-ub 16, the whole thing became temperamental and prompt throughput actually collapsed to around2.0tok/s. - At
-ub 32, it could survive a test run, but not in a way that inspired confidence. - At
64+, it was simply crashy.
So the practical production setting was not some elegant theoretical optimum–it was simply the highest value that stopped the Vulkan backend from crashing. That, in a sentence, sums up a fair bit of the experience of using this board.
Runtime Rankings
The runtime matters almost as much as the model:
llama.cppon Vulkan was the best all-round practical setup, but only after patching and tuning.llama.cppon CPU was useful as a baseline and for sanity checks, but too slow once model size started to climb.ik_llama.cppon CPU turned out to be dramatically better for some 2-bit and sparse-ish workloads than I had expected, to the point where it occasionally made GPU offload look silly.- [PowerInfer] remained interesting mostly in theory; in practice it was too awkward and too far behind the other options to matter.
GPU offload was not always the right answer. A lot of the marketing gravity around boards like this points you toward the GPU or NPU as the only interesting path, but once you start timing things, the answer is much more conditional.
Qwen3.5 35B-A3B IQ2_XXS was instructive. Under stock llama.cpp, far too slow. Under ik_llama.cpp, dramatically faster on CPU–to the point where it occasionally behaved like a real system rather than a cry for help. But it had a roughly 40% empty-response rate, consumed nearly all RAM and swap, and was slow enough end-to-end that I would only call it “working” in the same tone one might describe a vintage British car that has just completed a short journey without shedding visible parts.
For that model, the runtime comparison was actually rather stark:
- Upstream
llama.cppon pure CPU (-ngl 0) managed about0.63prompt tok/s,1.07generation tok/s and took76.67send to end. - Upstream
llama.cppwith a token amount of offload (-ngl 8) was, if anything, slightly worse at80.03stotal. ik_llama.cppon CPU was the surprise winner by a ridiculous margin:16.24prompt tok/s,5.24generation tok/s and12.75stotal.ik_llama.cppwith-ngl 8promptly ruined that advantage and fell back to a miserable71.33stotal.
Model Rankings
That is one of the more useful things I learned here: for some quantized models on this machine, CPU inference with the right runtime was not just competitive with GPU offload, it was much better.
The Liquid models were interesting for a different reason. LFM2 8B-A1B Q4_K_M managed roughly 46.7 tok/s prompt and ~32 tok/s generation on Vulkan–objectively impressive for the active parameter count–and LFM2.5 1.2B pushed generation to around 45 tok/s. On paper, these look like the hidden sweet spot. In practice both failed when pushed through the full agent pipeline: blank output, formatting failures, over-eager obedience to internal conventions. Useful to know, but not deployable.
For reference, the ranking I ended up with:
Qwen3.5 4B Q4_K_Monllama.cppVulkan at 9.7 generation tok/s was the only setup that felt production-usable.Qwen3.5 35B-A3B IQ2_XXSonik_llama.cppCPU at roughly 5.3 generation tok/s was the most surprising result–impressive, but too flaky and memory-hungry to trust.LFM2 8B-A1B Q4_K_Mon Vulkan at roughly 32 tok/s generation posted a great benchmark number but broke down in real agent use.LFM2.5 1.2B Q4_K_Mon Vulkan at roughly 45 tok/s generation was quick but not dependable enough to matter.Qwen3.5 0.8B Q4_K_Mon CPU at about 46 tok/s sounds good until you ask it to cope with a full agent prompt.
So yes, the board can run local models. It cannot run all of them well, and a distressing amount of the work lies in sorting out which bits of the stack are broken on any given day, but it was a much better experience than with Rockchip boards, and I intend to try out Gemma 4 and more recent models soon.
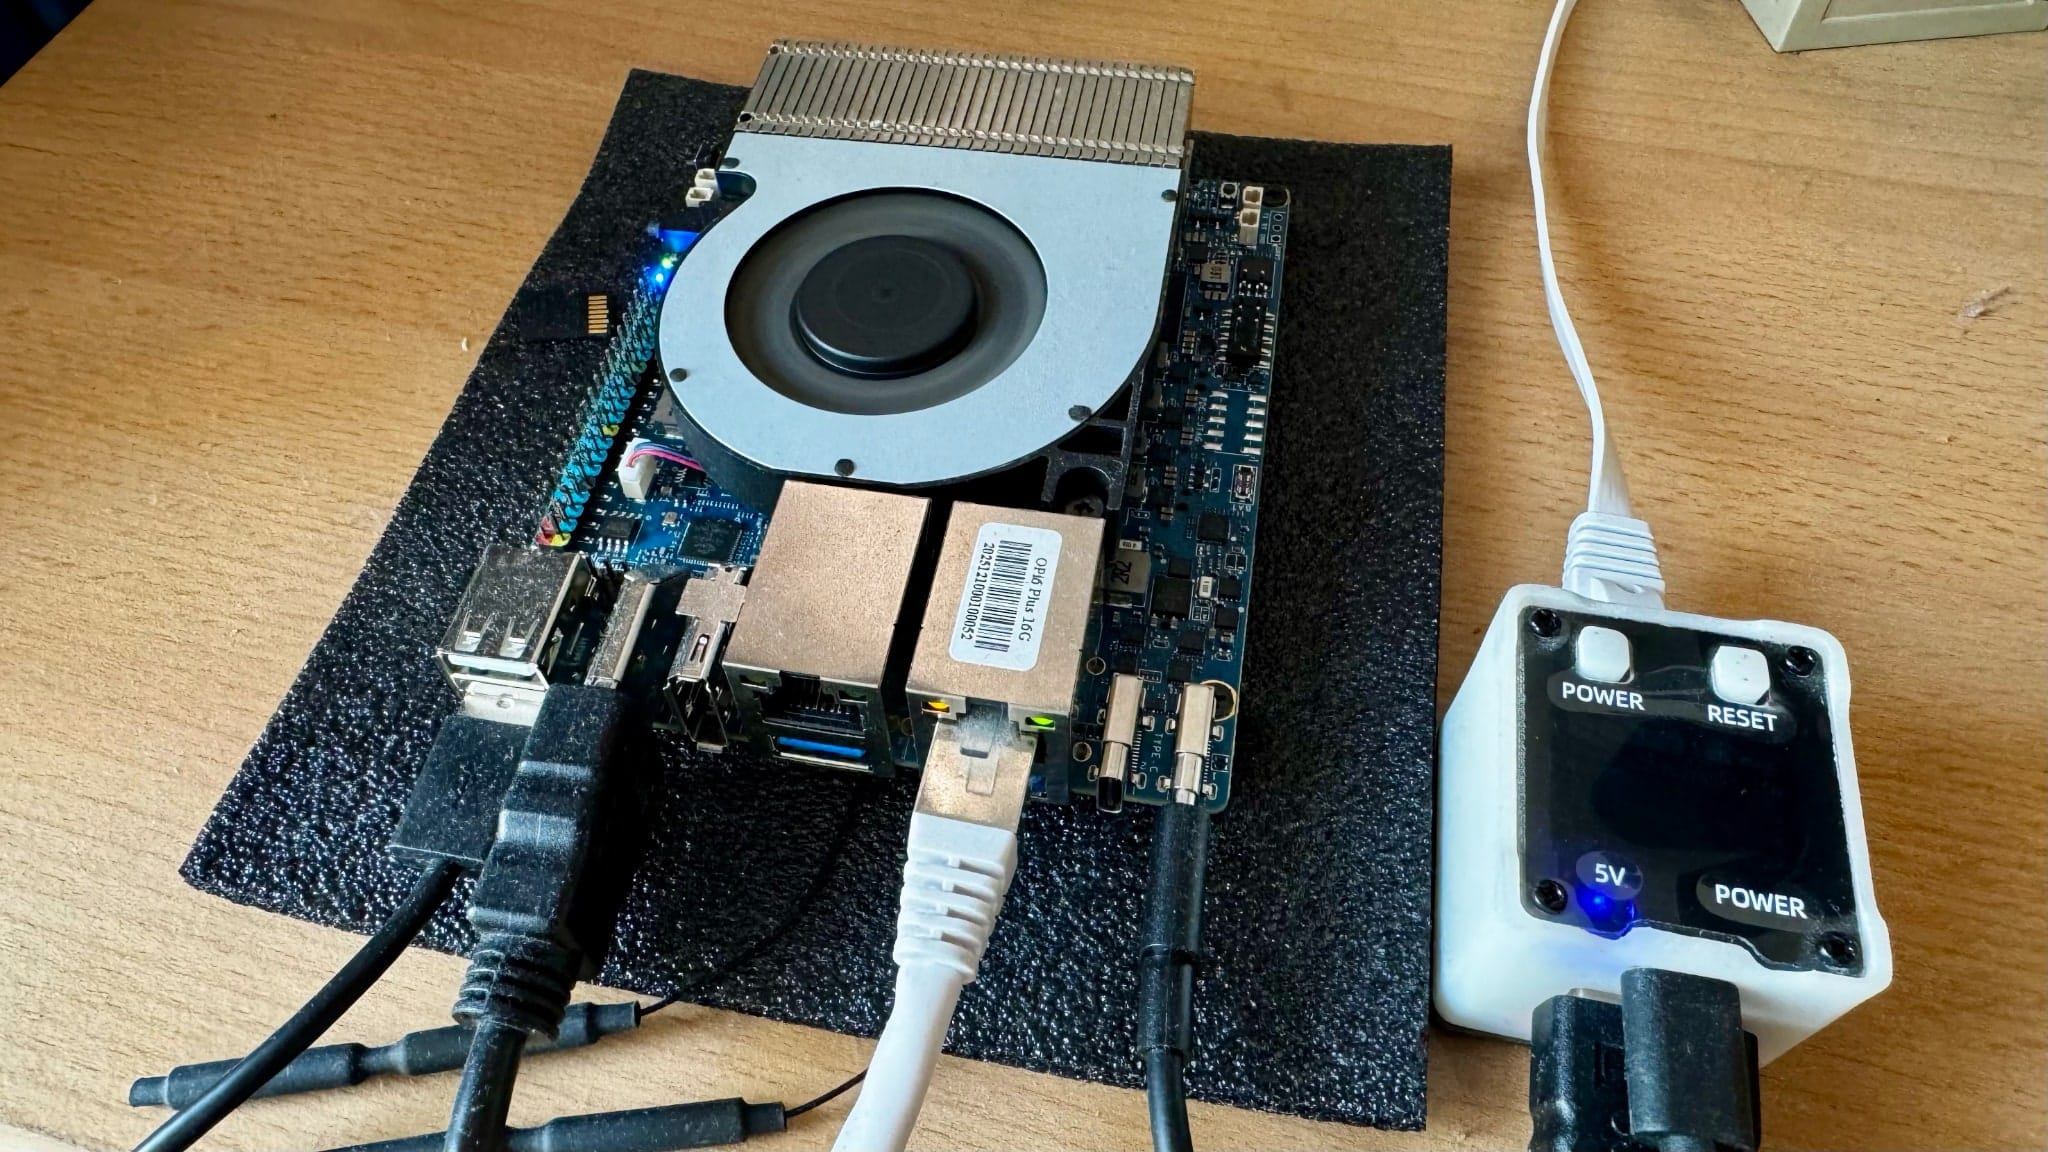
Fan Noise
While the above was going on, I kept tabs on both thermals and memory, since I expected sustained GPU or inference workloads to need active airflow. But I had to deal with the fan first, since the Orange Pi 6 Plus ships with a pretty beefy cooling solution that, sadly, is very on the loud side.
And there’s no fan curve–all you get with the CIX kernel is a sysfs interface via cix-ec-fan with three modes:
mutenormalperformance
The first leads to the CPU reaching fairly high temperatures under even moderate load, the last is unbearably loud, and the normal setting ranges from moderately quiet to annoying, so for most of the testing I moved the board to my server closet.
Benchmarks
Again, the CIX P1 has 12 cores, but they are not equal–four low-power Cortex-A520 cores clocked at 1.8GHz and eight faster Cortex-A720 cores spread across four clusters at different peak speeds (2.2 to 2.6GHz). The kernel’s cpufreq subsystem treats each cluster independently, which means that it takes a bit of effort to max out all the cores:
sbc-benchreported no throttling during its run, which was encouraging.- The aggregate 7-Zip score landed around 33k, with the best single A720 core around 3874 and the A520 cluster way behind at about 1617–a nice reminder that workload placement matters on this SoC.
- Memory bandwidth on the A720 cores was respectable:
libc memcpyin the 15-17 GB/s range,memsetoften 35-47 GB/s. - The A520 results were dramatically lower across the board.
Memory Bandwidth
An interesting twist I lost some time exploring is that you can actually see some differences per CPU cluster, which is new for me in ARM machines:

Blue bars are memcpy (read-then-write), red bars are memset (pure write). The A520 cluster is roughly half the bandwidth of the A720s across both. This matters for inference because memory access patterns land on whichever cores the scheduler picks, and a hot path pinned to the efficiency cluster is immediately noticeable.
Thermals
On a quiescent system, sensor readings were good–most blocks hovered in the high twenties to low thirties Celsius:
GPU_AVE:29°CNPU:30°CCPU_M1:30°CCPU_B0:32°CPCB_HOT:33°C
The thermal logs during the benchmarks were more reassuring than I expected:
- idle and light-load readings sat mostly around 29-33°C across GPU, NPU and CPU blocks
- under the longer benchmark runs, board and package sensors generally rose into the mid-30s to about 40°C range, which is very good (but, as you’d expect, audibly noticeable from outside the closet)
- frequency traces showed the active cluster spending long stretches pinned at its target clocks before later dropping back, which looked much more like workload phase changes than panicked throttling
- One benchmark artifact I largely ignored was the
iozonerun, because it was aimed at/tmpand therefore mostly measuring the memory-backed path rather than telling me anything meaningful about persistent storage.
Here’s a new chart that tries to capture thermals and frequency a little better than my old ones:

The above covers the full sbc-bench session–roughly 40 minutes of mixed workloads.
The three shaded phases correspond to what was running at the time: a short iozone burst (memory-backed, not interesting), the main sbc-bench battery (OpenSSL, 7-Zip single and multi-threaded, tinymembench across all clusters), and the trailing cooldown.
The key thing to notice is that frequency stayed pinned at target clocks throughout the heavy phases and only dropped back during transitions–there was no thermal throttling, which is pretty amazing.
Temperature peaked around 43°C during the sustained multi-threaded 7-Zip run, which is well within spec for a board with active cooling. The idle baseline was around 29°C, and it settled back there fairly quickly once the load came off.
One thing I could not track was fan speed, since the cix-ec-fan interface does not expose current RPM or duty cycle, and I had no way to correlate the thermal curve with what the fan was actually doing at each point. I could hear it spin up and settle, but I have no real data to overlay, and even though I considered setting up a dB meter, I never got around to it.
Living with it
All of the above covers the first week or so. But I’ve been running this board as an always-on machine since March 8, and by now have a month’s data on what it’s like to live with.
The board now hosts a piclaw instance (my personal assistant) that I’ve been using for development and model testing, since I realized that LFM2-8B-A1B made for a faster thing to experiment with (31 t/s generation, 47 t/s prompt on Vulkan) even if it’s effectively not that “smart”.
Alongside the assistant work, I’ve been using the board for a real development project: porting the BasiliskII classic Mac emulator’s JIT to AArch64.
Over the past month that has meant a good deal of compilation, linking, automated experiment runs and testing. The JIT now executes real 68k ROM code with basic optimisations–interrupt delivery and display rendering are the active frontier, but it boots to a Mac OS desktop every now and then. The constant rebuilds around AArch64 JIT bugs I hit (broken optflag inline asm bindings, various register allocation and flag bugs in codegen_arm64.cpp, VM_MAP_32BIT allocation failures, repeated runs at fixing emulated 68k interrupt delivery) were genuine low-level issues that exercised the board’s toolchain and memory subsystem in ways no synthetic benchmark would, and it’s been working great.
Power Consumption
One thing that came up in every review of the CIX P1 I read–[Jeff Geerling’s Orion O6 writeup][jg] being the most prominent–is power draw, and I have a month’s worth of data to confirm that it’s higher than average–averaging at 15.5W, rather than the usual 13W that I see quoted in other places:

The flat zeros on the left are the setup period when I was reflashing and debugging offline. Once it came up as an always-on machine the power draw settled into a consistent daily pattern.

Zooming into the last week at 15-minute resolution, the daily idle/load cycle is clearly visible–overnight the board drops to about 15-16W, and during the day it hovers around 20-27W depending on what I am doing. Compilation and inference bursts push it briefly toward 30W; the rest of the time it sits comfortably in the low twenties.
That said, the idle floor of 15-16W is noticeably higher than what I am used to from other SBCs. A Raspberry Pi 5 idles around 3-4W, an RK3588 board typically settles around 5-8W, and even a Mini PC with an N100 can idle below 10W.
The Orange Pi 6 Plus never really gets below 15W even with nothing running, and that appears to be a common trait of the CIX P1 reference design rather than anything specific to this board–the Radxa Orion O6 (same SoC) shows a very similar baseline in the reports I have seen.
Whether that is down to the memory controller, the 5GbE PHYs, the always-on fan or some combination of all three, I cannot say for certain. But it does mean the board is less attractive as a low-traffic always-on appliance than the raw compute-per-watt numbers might suggest. At 15W idle you are paying about 130 kWh/year just to keep it breathing, which is not terrible but is not nothing either.

I checked, and current draw mirrors the power profile and stays well under 0.2A on the 230V circuit. The board’s power supply is not doing anything exotic.

The voltage trace is mostly here for completeness–Lisbon mains hovering around 230-232V with the usual overnight sag and daytime recovery. Nothing that would stress any reasonable power supply, and useful as a sanity check that the power readings are not being skewed by wild grid swings.
Reboots over the month: essentially none that weren’t my doing. The board has been stable in a way I did not expect from the early boot-chain experience.
Conclusion
After all of this, the Orange Pi 6 Plus fits a fairly specific set of roles:
- local inference experiments with carefully chosen models
- edge-side telemetry or monitoring
- compact Linux services that benefit from dual 5GbE
- infrastructure roles where you want something denser and lower-power than x86 but more capable than the usual toy SBC
I wouldn’t use it as a general-purpose desktop, and I wouldn’t trust the NPU story for anything LLM-related without more soak time. But I would keep it around for the sort of edge-AI and systems work I usually get drawn into–enough real capability to justify the effort, even if that effort is, right now, unreasonably high.
Even considering that I cut a lot of corners on the software side to get to a usable state, the hardware is still very much ahead of the software.
The GPU works, the NPU stack exists in some recognisable form, and local AI is not only possible but occasionally good, and I like what it can do, even if the power consumption and fan noise are higher than I would like for a board in this class, but compared to Rockchip’s offerings, it’s a much more polished experience–and the fact that I can get it to do useful work at all by myself, with my own OS image, is a testament to the progress ARM boards have made in the last couple of years.