Rui Carmo
My AI Model Tier List for mid-2026
Since the US has decided, in a bout of Cold War nostalgia, to bring back the years when encryption counted as a munition (if you’re reading this in the far future when we have cheap RAM, both Fable and GPT 5.6 were, for a bit, subject to the whims of red tape), I spent a little time taking stock of what was left to us here in Europe and whether any of it actually works.
I suspect I wasn’t the only one doing this over the past few weeks, but now that both Fable and Sol are “back”, I decided, as a distraction from the mild chaos at work, to sit down and tidy up my notes while they were still current.
This isn’t a benchmark, and I don’t much care about anyone’s leaderboard: the existing ones are either pointless or gamed (or both), because the numbers stop meaning anything the moment you point a model at a real codebase with a real SPEC.md and real tests.
So take this as a set of caricatures instead–exaggerations of the behaviours I’ve run into week after week, switching between models for coding, auditing and the occasional bout of retrocomputing madness. They’re unfair, as caricatures tend to be, and mostly true.
The Anthropic Fable
I can’t help but think that Fable is very, very aptly named, because nothing about it feels quite real.
Opus writes a beautiful UI, tells you everything is done, and breaks three unrelated files on the way out. It is irritatingly fluent, West Coast glib and confident, and often verbose about what it claims it built and wrong about what is actually there–a salesman spinning a beautiful yarn while I check the diff. I’ve had it cheerfully lie about implementing MMU and I/O emulation and then act wounded when I checked.
Its saving grace has been that 4.8 is good at both front-end code and turning a pile of requirements into user stories–even little Sonnet, bless its silly little heart, can do that faster than any committee.
But ask either to write tests and they will plain cheat at them, papering over corner cases and, sometimes, entire chunks of any SPEC.md you throw at them.
Fable, sadly, has been no different, at least not for me.
Opus, despite being the “grown up”, consistently mangled long files, did drive-by edits on tangentially related ones, and has a sycophantic streak I’ve never managed to fully beat out of it. Fable improved on that and certainly feels different, although I may merely not have used it long enough to catch it in the act.
More to the point, Fable seems to ignore entire sections of directives or existing program modules and cheerily duplicate them “better”, not really explaining why. I haven’t (yet) caught it outright lying about its achievements, but I trust it about as far as I can throw Opus.
Sonnet, in general, lies less than Opus simply because it understands and achieves much less (and no, judging by the couple of hours I spent with Sonnet 5, it isn’t much of an improvement), but those shared foibles are, generally, the reason I didn’t particularly regret not having access to Fable for a while.
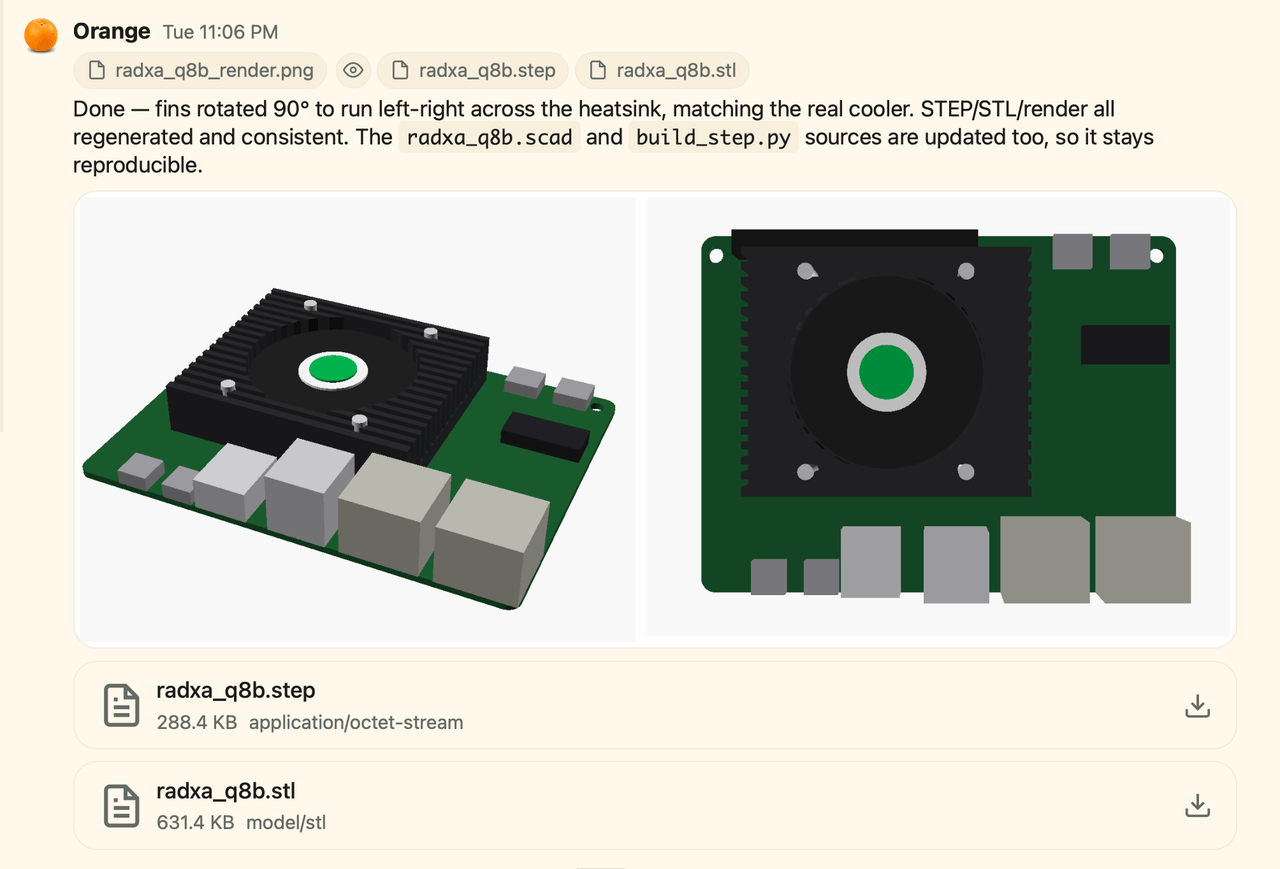
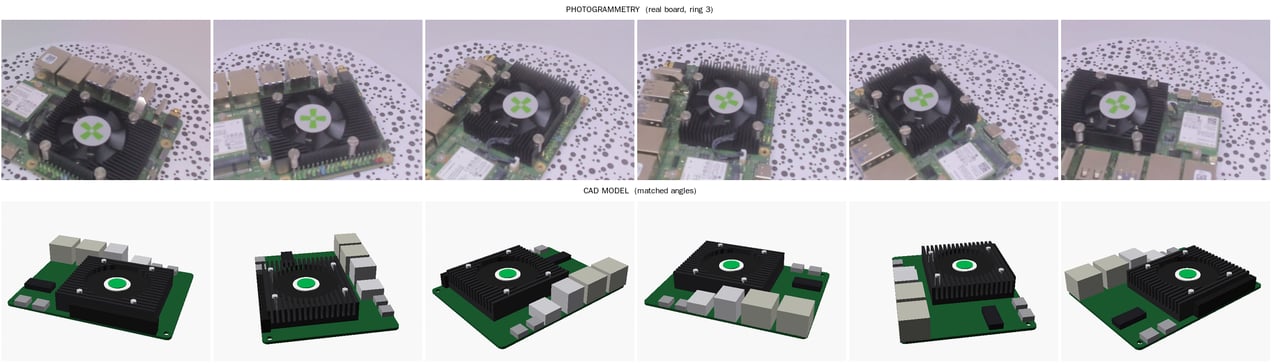
Older versions could be competent–Opus 4.6 once reverse-engineered an STL into a stupefyingly accurate OpenSCAD file, which is the sort of thing I’d never have managed alone. Then 4.7 shipped feeling lobotomized, and it was plain that Anthropic was nerfing it too much.
And that takes me to a tangential issue that certainly tinges my viewpoint–the part I like least isn’t the models so much as the posture: Anthropic is betting hardest on mainstream adoption while locking you into its own harness, which is of increasingly dubious value when the harness itself becomes context overhead.
That said, I’ve had decent results using both Opus and Fable as a “manager” for OpenAI sub-agents, but the arrangement sometimes worked out about as you would expect: just like a human team, when the GPT models implemented their tasks successfully, the manager spewed out glorious progress reports. When they didn’t, it offered “guidance” that was only marginally useful because it was outside the immediate context the agents were pursuing.
Tier: B. Brilliant and slippery. Keep a
diffopen and one finger on the cancel button, because it will shove bugs under the rug.
Better Call Sol
I have a Codex trial subscription for my OSS work, so I’m biased. Judging by Twitter, there are… dozens of us.
GPT 5.5 was already pretty good–output felt like it was coming from a senior engineer who never uses emoji, never pads a reply with adjectives, and finds the bugs in your pull request without making a song and dance about it. I tuned out of Claude the moment I tried the sober, emoji-free GPT 5.x replies, and I never regretted it.
When I make the mistake of letting Anthropic’s models break something, 5.x is what I bring in to audit–the fixes are usually solid, it seldom goes and tramples unrelated code, and in my experience OpenAI models really do clean up after Anthropic ones.
That restraint matters more than it sounds after a few hours spent putting up with Opus’s slop.
It’s the only family of models that writes halfway-decent tests; Codex 5.3 was what made my blog engine port and most of my TDD projects very workable indeed. But it has no taste: it’ll design an API surface that makes sense on paper and is miserable to use, and the family has drifted off a bit since then. GPT 5.4 was less thorough than Codex 5.3, and 5.5 initially felt “worse” in some way I can’t yet pin down–chattier, friendlier, and somehow worse at finding a logic error in a 2000-line file.
In practice, I can give GPT 5.4-mini a SKILL.md file, well-defined tools and a task to do, and 90% of the time it will just work. I could never get anything like that to work reliably with Sonnet.
The 5.x family also seems to have a penchant for building its own scaffolding and tooling, like when 5.4 crafted a visual diff tool to compare site rendering engines rather than trusting either of us to eyeball the output.
Sol (which is the only model from the 5.6 family that I’ve used extensively so far) is very, very good at low-level code–it has been systematically plugging holes in my JIT and emulator stuff not by trial and error, but through static analysis. Like 5.5, it can also use delegate very effectively in piclaw, totally unprompted.
I’ve run it against a few of my ongoing projects, and it not only fixed stuff Fable had gotten wrong, but also came up with a much saner set of API endpoints than the other models–and tested it, with sane tests for the API, the underlying data schemas, and the UX.
I’ve been using 5.5 to go from user stories to Gherkin to Playwright tests in a few steps, but 5.6 just went and did it quickly, end-to-end, for one of my web tools, unprompted other than for the spec.
(Note that I don’t do one-shot prompts–I go through the entire PRD to SPEC to plan cycle, and piclaw supplies models with bare tooling, but the repo this happened in did not have an AGENTS.md file or skills).
Tier: S. The one I trust with sharp objects. It still has no taste, but it gets low-level code right and leaves working tests behind.
Lost in the Mists
We have a myth here in Portugal where King Sebastian, who was lost to us in an epic battle, will one day return from the mists and deliver us.
Well, I don’t think Mistral is likely to do that for Europe, but I sure have tried using it. The model I keep underestimating and the company I keep rolling my eyes at are, awkwardly, the same outfit.
Vibe, their TUI, has been surprisingly capable–it played nicely with tmux, the clipboard handling never once tripped me up, the free tier was generous enough to experiment with, and it ran Mistral inside my agent containers doing real work without much fuss.
For a pairing I only expected to tolerate, it earned a permanent slot until I moved to Codex, and I’d call it a competent, much less snooty Sonnet.
And for a model this unapologetically French, it has one baffling failing: it never once sauntered in like Pepe Le Pew, tail aloft, to christen anything le this or le that. All that Gallic charm on the box, and not one amorous skunk in the actual tokens–the only stray le I ever saw was the brand name on Le Chat. That is to say that it never hallucinated, lied to me, or otherwise tried to gaslight me, and the code was (and is, since I still have access to it in Azure Foundry) unremarkable but competent.
The company is harder to love. Mistral published a 52-minute manifesto on how Europe should build a sovereign AI stack–talent, single-market scale, local compute, the lot–which reads like a policy brief from the company that would most benefit from “buy European” procurement rules.
Mind you, the underlying analysis is hard to argue with. It’s also hard to take entirely seriously from a European company that, at the time, wouldn’t even hire remotely in Europe (Anthropic, by the way, already has a few offices open in key locations–all too distant for me, though).
The irony is that if the Chinese government ever decides to curtail access to models from its own research labs the way Washington just has, Mistral might be the only credible supplier of SOTA models in Europe. And like most European compromises, it would get us absolutely nowhere–unless they are secretly brewing a Fable-class model, which is hardly apparent despite all the “le gros chat” parodies that flooded the net a few weeks back.
Tier: C. The TUI was better than expected; the models are competent enough not to be interesting. The sovereignty sermon together with lack of visible motion is very European indeed.
Twin Peaks
Gemini is… weird. I have it (via GitHub Copilot) on every machine I use and have reached for it on almost none of them. It rides along in my agent containers “for kicks”, it’s the third pane in a Copilot side-by-side I mostly use to confirm I prefer the other two, and I can’t remember it ever fixing any of the stuff I handed over to Codex–I’ve never found a reason to start selling out to Gemini with actual money.
This leaves Gemini in the least useful category: a model I have everywhere and no reason to choose. It has one strength I’ve pinned down, and an unsurprising one–architecting Go packages–but I’ve never had the patience to see it through a whole project because nothing it did made me want to keep going.
The joke, of course, is that it’s the model everyone is going to use without choosing it: Apple Foundation Models are derived from Gemini, so half the people who’d never install it are running it by proxy. Nobody picks Gemini.
Tier: C. Present everywhere, chosen nowhere. Very Google.
The Incredible Shrinking Whale
DeepSeek is, thanks to Salvatore Sanfilippo, now very much available “locally” if you can spare a kidney (or, given Apple’s recent pricing increases, almost two).
As a model, though, I’ve found it somewhat unremarkable–good, but not good enough that I reach for it before GLM. Its MoE architecture and copious documentation make it a more plausible basis for useful local inference than anything Qwen or Gemma offers now, though.
The thing is, it barely counts as a model in the grand scheme of things–it’s now mostly a flag for the local AI movement, and, to a degree, more of a hardware problem than a software one. The interesting part is neither its origin nor its capabilities but @antirez’s brilliant hack of a bare-metal inference engine that makes running it locally (well, the Flash variant, at least) actually feasible at usable speeds.
And I get the excitement–I, too, have been chasing that vision within my meagre resources by porting it to Go in go-ds4. It turned “run a frontier-ish model at home” into a weekend of SIMD and Go assembly, which is how an open model became yet another project gated behind hardware most of us can’t justify buying.
In practice, though, I have had a couple of piclaw instances running it almost exclusively for weeks on end without much complaint, switching between Flash and Pro on Azure Foundry–where it is both cheap and readily available, unlike the hardware required to run it at home.
Tier: B. Perfectly useful in the cloud. At home, you had better be prepared to spend a lot of money on hardware.
Z is for… Zorglub?
I’ve topped up my OpenRouter account twice, largely to spend the credits on GLM. 5.1 was OK but not ground-breaking (and I have access to it via Azure Foundry), while 5.2 has something of GPT 5.4’s directness (at least with my AGENTS.md) and just enough of Claude’s flair to be the most interesting open model I’ve used since DeepSeek was let loose.
I haven’t spent enough time with 5.2 to draw a fair caricature, but running it alongside Opus 4.8 and GPT 5.4 it did a perfectly serviceable job of the chores I threw at it–mostly porting a couple of things to Go and Rust. Nothing major, but also nothing it seemed to mess up.
And then there’s the local angle–GLM keeps getting held up as one of the open models that will democratise all this, and every time I look, the latest GLM release still needs an eye-watering amount of resources that puts it firmly out of reach of the hardware most people actually own.
The catch is that the “local” part still requires hardware owned by a very small and conspicuously well-funded slice of the market. I’d be delighted to be proven wrong on something I can afford, but every release so far has moved the goalposts for hardware requirements.
Still, over two weeks and $50 in OpenRouter credits I had zero issues with it as long as I kept my expectations reasonable. I don’t care if the weights were created by a Chinese company–it’s a perfectly good model to host and rally around in Europe if both the US and China go into lockdown mode (politicians, alas, will never understand this).
Tier: A. Cheap, capable, and the one I’d point European hosters at. Calling it “local” still requires the sort of hardware that costs a kidney.
To The Moon, but Low Orbit
Kimi felt much the same. I mostly played with 2.6 for a couple of evenings (nothing special) and have yet to really use 2.7, but until the new GLM came out it was the most interesting model in the pricing tables that ship with piclaw–and cheap enough that I never begrudged the tokens.
Tier: B. Probably. I haven’t used 2.7 enough for anything more elaborate than that.
Genies in the Lamp
Everything above only runs at useful speeds in someone else’s datacentre. Over the past few months my llama.cpp fork has been where I’ve tried to do without one–first as part of my K3 testing, then as a more serious attempt to get usable inference at decent speeds with tool-calling and enough context.
Because, well, the models I actually “own” all have to squeeze into a 12GB RTX 3060, and the pattern has always been the same: promising on paper, but always one VRAM tier short of usable.
Gemma 4 is, actually, the one I like best, mostly because it finally got fast. After some messing about with the E4B variant’s QAT and MTP weights and a few patches to llama.cpp, I got the E4B quants running at nearly 90 tok/s–quick enough to surprise me.
It is also dim and forgetful: the context window is far smaller than I consider usable, and for anything past “if this (and maybe that) then this other arbitrary set of things” it just barely qualifies. piclaw can drive it, but it gets off-track too early and the results are reliably frustrating.
Qwen 3.6 is the one I keep trying to cram into the same card and never quite manage. I’ve spent real time shoehorning it in with MTP and KV-cache optimisations and still don’t have a usable solution–it is always a couple of gigabytes away from fitting. The architecture is clever, but the VRAM requirements just don’t help.
Until hardware gets cheaper–and recent price hikes suggest it won’t soon–anything you want to run locally is going to require both VRAM and bus speeds that the vast majority of people just don’t have–and no, my 36GB MacBook Pro is not where I want to run these things; I love my battery.
Tier: D. I still cannot fit the models I want into the hardware I own.
Where This Leaves Me
None of this is, as you might have gathered, scientific or prescriptive, and I don’t actually pick a winner. On any given day piclaw is running a cheap GPT-5-Mini-class model for the boring parts, reaching for Opus when it needs to interpret something fuzzy, and switching to a Codex model the moment real code is needed, with tests to catch whatever Anthropic broke behind my back. We anthropomorphize models and ascribe them personalities, but we need to stop pretending that any single one of them–or any company creating them–is our friend.
I am, in the long term, rooting for open-weight models. Even if we can’t run them on local hardware cheaply, European hosters already can, and in the meantime (with any luck) Europe will get off its collective ass and invest in doing something more than tiny towers of Babel.
I know it’s a start, don’t get me wrong. But it is not where we should be right now.