Following my recent adventures in 3D printing (which encompassed printing dozens of Gridfinity bins for organizing my office and a lot of test pieces in various filaments) I spent a few days with irritated sinuses, so I decided to investigate if there was any correlation.
Even though I have spent most of Spring and Summer with my office window open and a fair amount of air flow coming from other parts of the house, I was wary of the smell from some of the PLA filament I was using and wanted to make sure things were OK, so I went about that and finally have something to show for it.
Hardware
What I thought I wanted was an air quality sensor. What I got was another interesting puzzle to solve.
I had been considering getting something for a while due to my seasonal allergies and IKEA has a cutesy one called VINDRIKTNING that has been hacked to work with an ESP8266, but that doesn’t appear to be available in Portugal (just like properly sized kitchen countertops, but that’s another story) and has been reviewed as being somewhat imprecise.
So I decided to see what else was out there and stumbled upon the quite popular PMS5003 particulate matter sensor, which you can get just about anywhere.
At first I was pondering hooking one to one of my many ESP8266/ESP32 boards, but Pimoroni just happens to have an Enviro+ HAT that fits one of my spare Raspberry Pi Zero Ws, has a glanceable (if tiny) display and a port you can plug in a PMS5003 onto1.
Since I’ve used several of the Enviro+’s ancestors in the past and I can run other things on the Zero (GPIO pin availability permitting), that seemed like the way to go for an initial approach.
Software
A stock Raspberry Pi Zero W has only 512MB of RAM, but unlike the 3A I set up as a thin client it has a single 900MHz core, so I had to be parsimonious.
However, I can do a lot more with it than with a Pico W, so within a couple of hours I had:
- A Python script to read all the sensors, update the display and send out measurements via UDP every 5 seconds
- A Node-RED flow that picked up those measurements, computed 15 second and 5 minute averages and published them to:
- A local SQLite database with 30 days of history
- A set of virtual HomeKit sensors (which were much easier to publish inside Node-RED than in Python)
- The house metrics database, which gathers year-round metrics from all sensors via
MQTT.
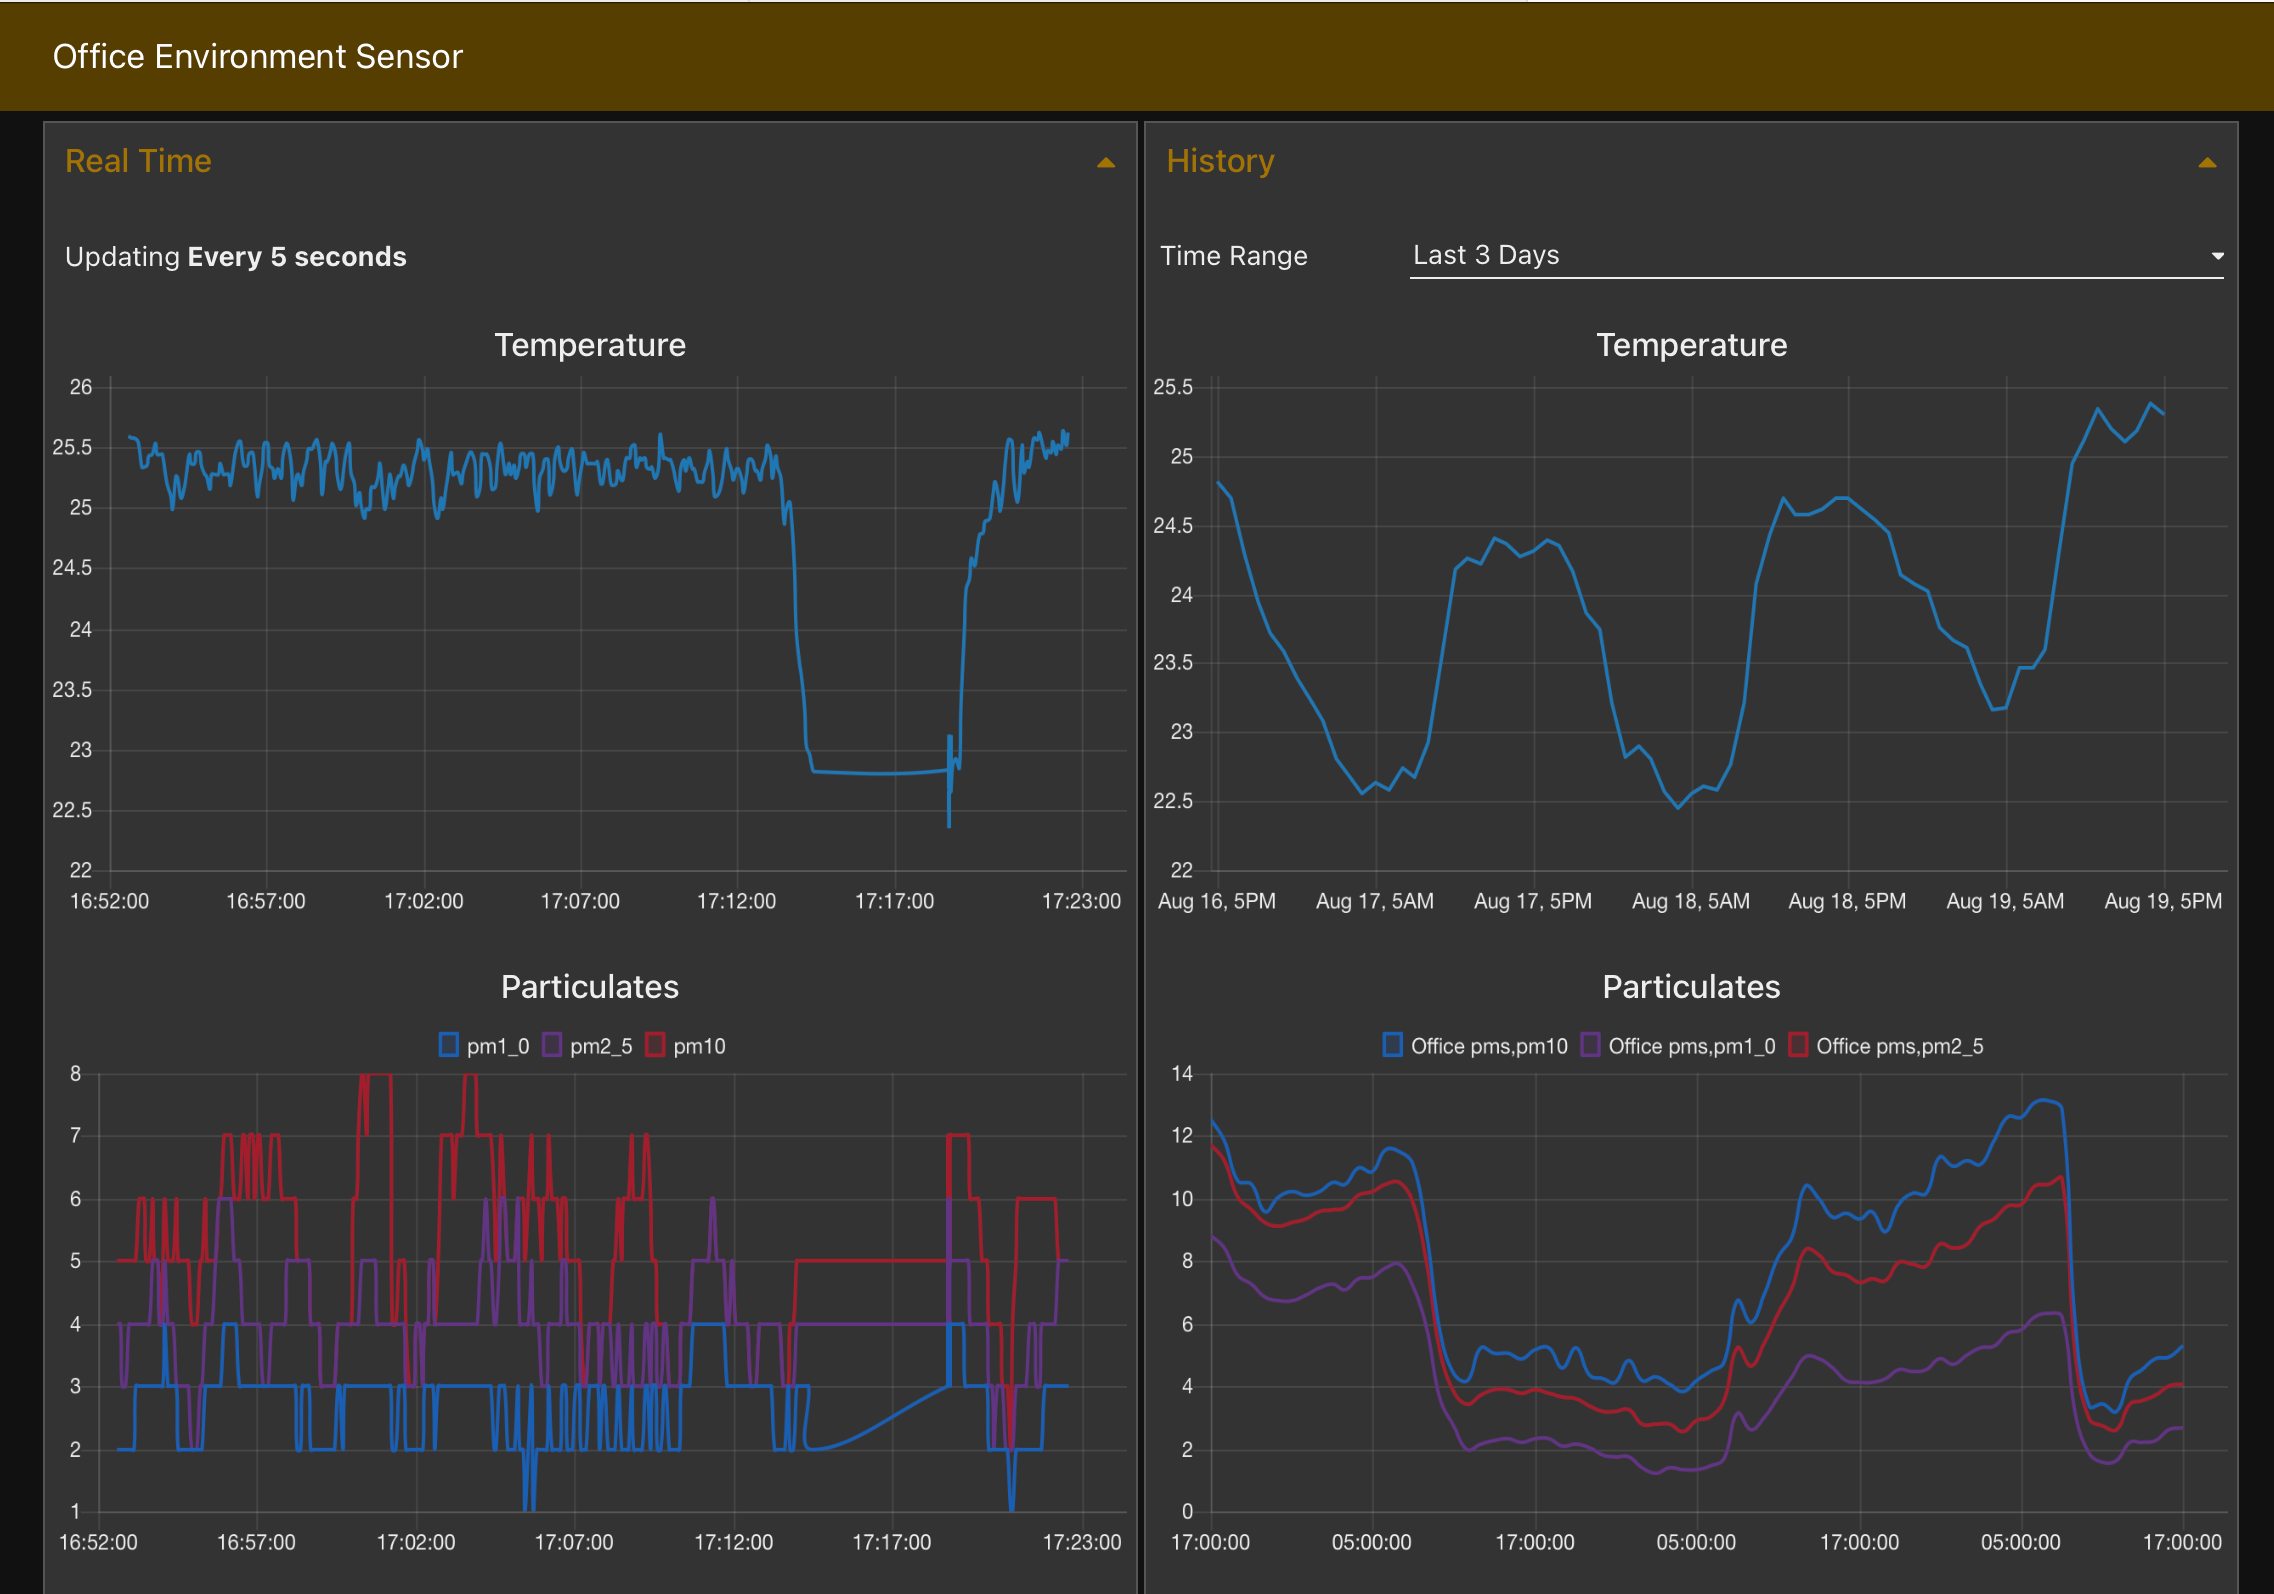
The end result looks something like this:

There are plenty of alternatives out there (including dedicated Homebridge plugins), but this setup was the least amount of hassle for me to deploy (although getting a modern version of nodejs to work on an armv6 Pi is still a pain).
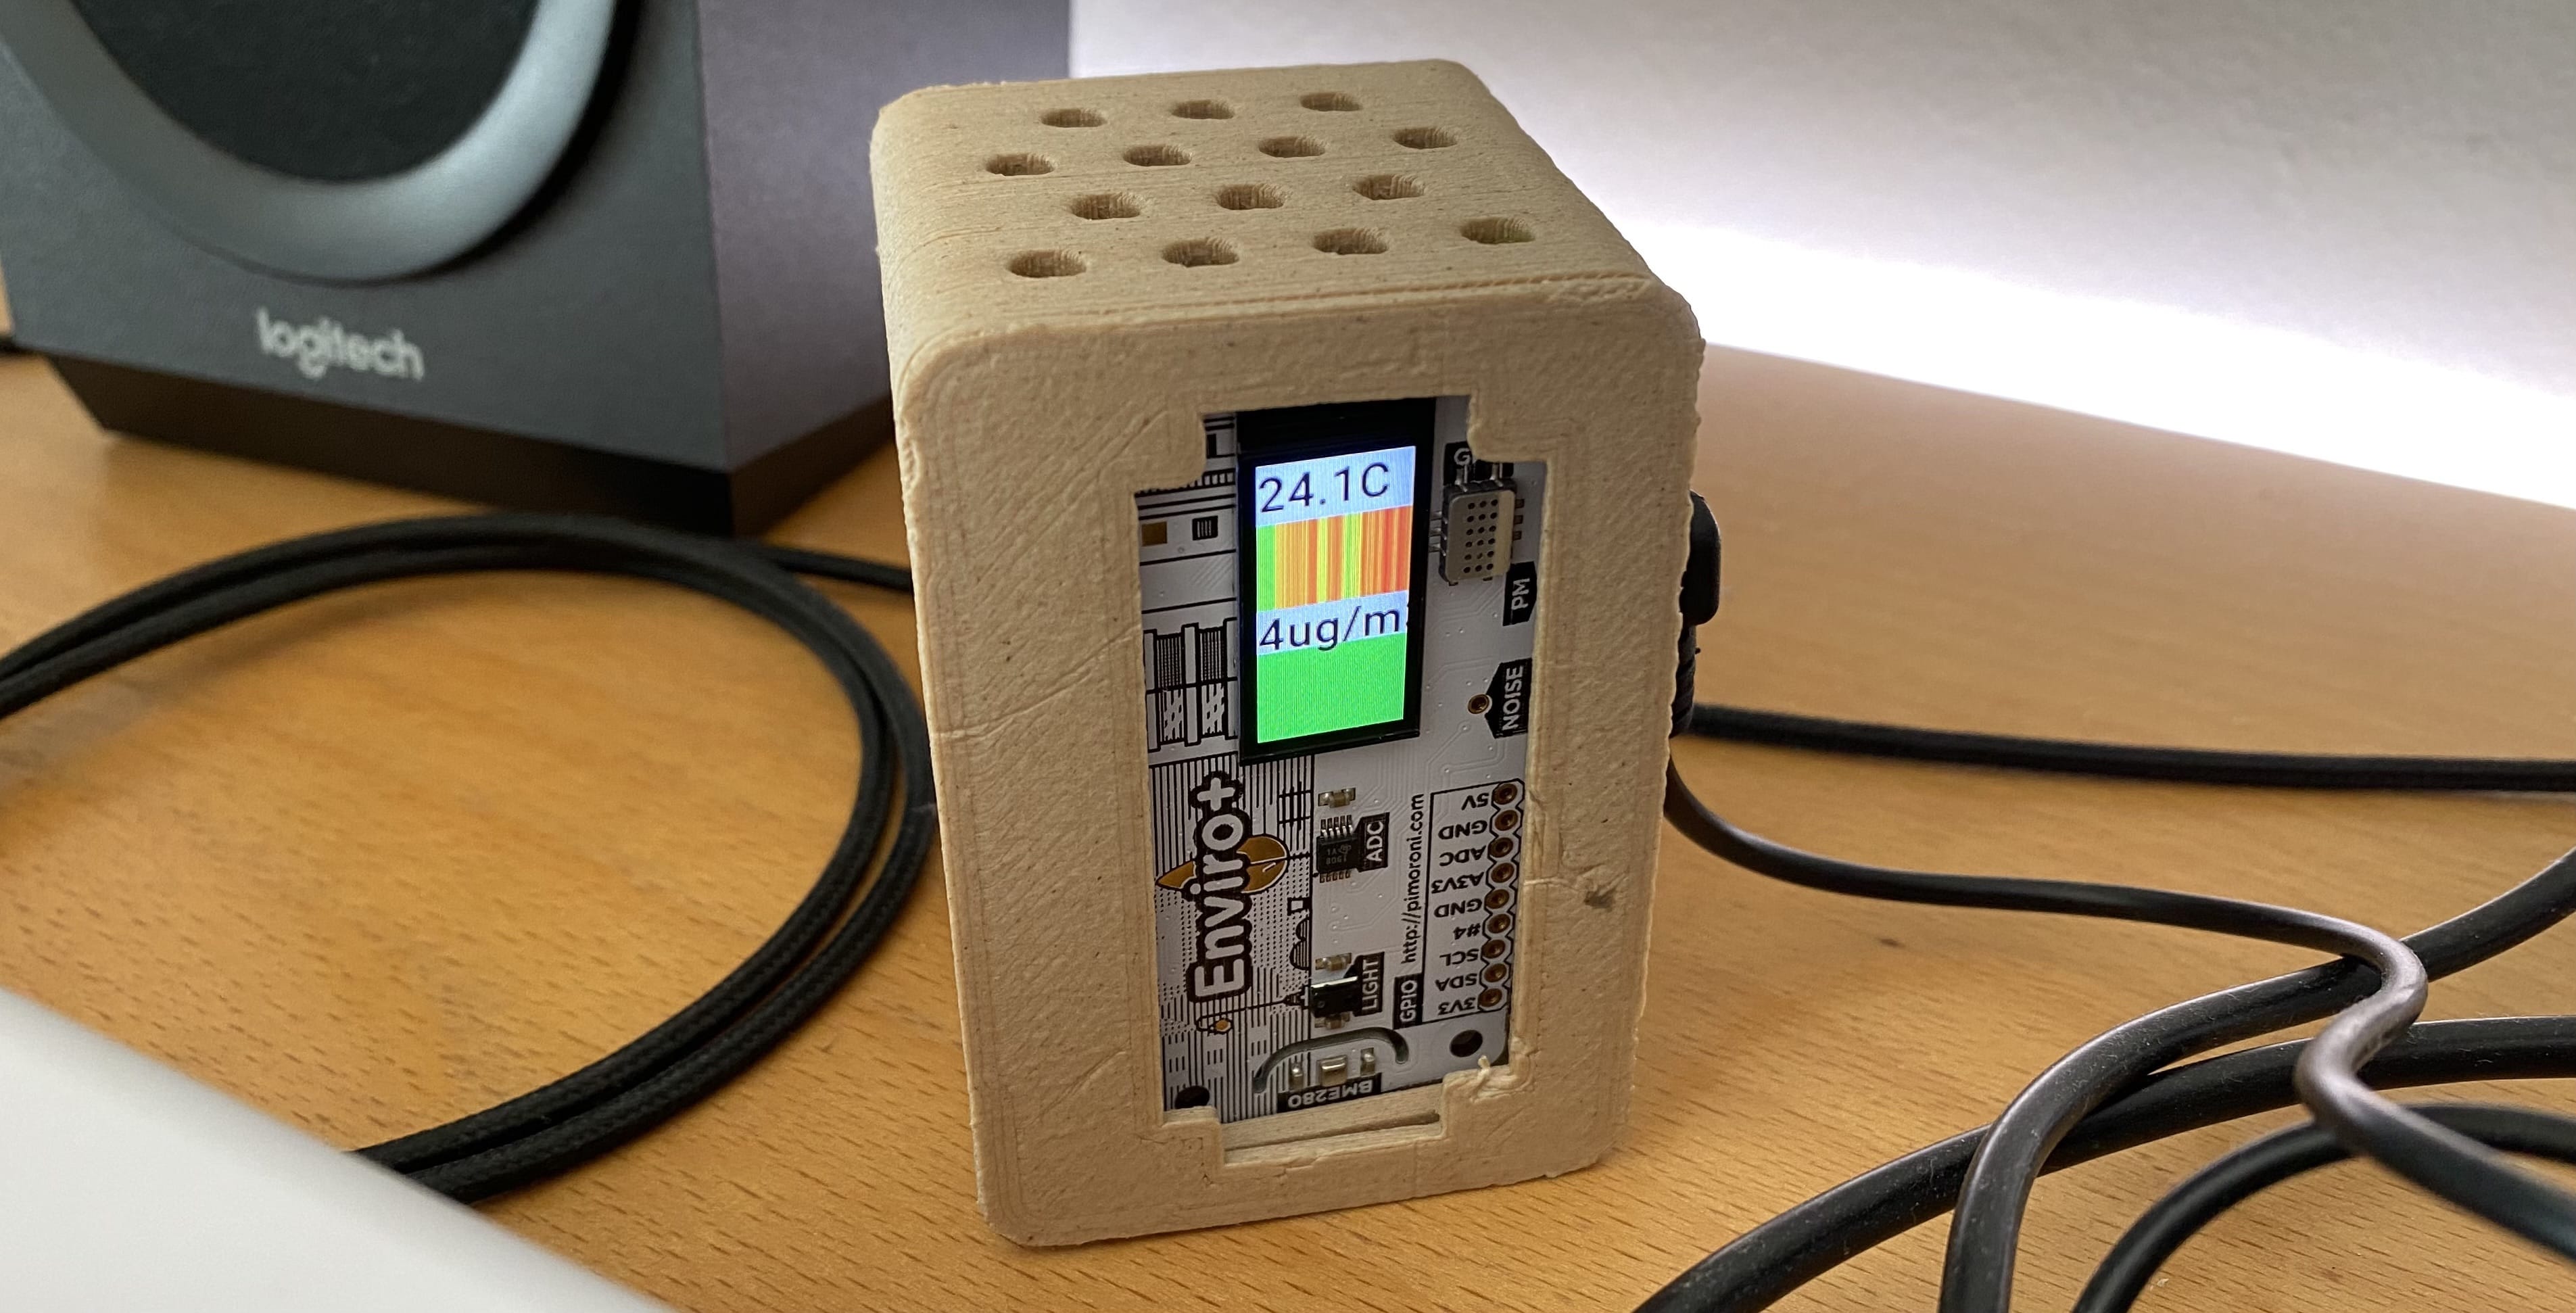
After printing a nice little case for it, the Pi Zero became its own little HomeKit gateway to expose all the sensors (at least the ones HomeKit recognizes), and now sits on my desk showing a temperature plot and a color-coded air quality display:

I haven’t bothered with doing a chart for PM2.5 values since they don’t change as often as the temperature (even with the window open and a draft throughout the house), but decided to paint the little square below the µg/m3 count with the US Air Quality Indicator scale:
us_aqi_pm25 = [
    [0,"good",(0,255,0)],
    [12.1,"moderate",(255,255,0)],
    [35.5,"sensitive",(128,128,0)],
    [55.5,"unhealthy",(255,0,0)],
    [150.5,"very unhealthy",(255,0,255)],
    [250.5,"hazardous",(80,80,0)]
]
However, one of the things dealing with various sensors drummed into me from very early on is that raw data is often useless without proper testing and calibration, so I sat back, let things run for around a month and then started poring over the results.
Conclusions
First off, the PMS5003 is not the right tool for the job. It might be good enough for general air quality monitoring, but not for pinning down the causes of my (apparently) 3D printing induced sinus irritation.
3D printers emit VOCs (volatile organic chemicals), but which ones and what volume depends on the kind of filament (PLA supposedly emits nearly none) and they simply do not register on the PMS5003 operating range, nor directly on the MICS6814 gas sensor the Enviro+ comes with2.
But now that I have something going, it’s easier to iterate. I thus spent a couple of evenings poring over the matter and figuring out the best kind of sensor to detect VOCs, and a bit more research led me to the BME680 sensor by Bosch, which is a close cousin to the BME280 already on the Enviro+.
The BME680 provides (using Bosch-written code) an air quality measurement (IAQ) and a VOC measurement, but (and this is the interesting bit) they are effectively estimated from both humidity and resistance measurements.
So in theory I might be able to use sensors already on the Enviro+ to do my own estimations, but in practice I couldn’t really get a metric I liked yet, and I’m not positive the MICS6814 sensor provides comparable measurements3.
But there is an alternate library with a great README that goes into a fair amount of detail regarding how to compute IAQ, so I am quite likely to have another stab at this. And if all else fails, I will just get hold of a BME680 or a BME688 and add it to my setup.
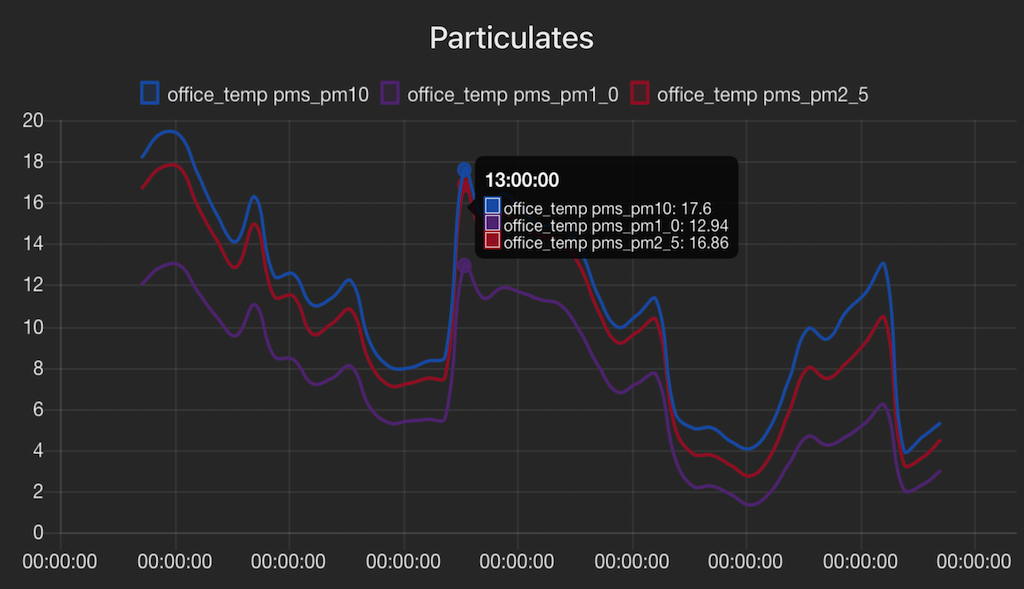
The PMS5003 does, however, seem to respond quite accurately to fires (of which we’ve had plenty over the past few weeks), to traffic patterns and to the neighbor’s barbecue:

Too Warm and Cozy
I also had a considerable amount of trouble measuring something as simple as temperature at my desk, and want to spend a couple of paragraphs pointing out why.
Anyone using Enviro boards should be aware that the BME280 temperature sensor is far too close to the Raspberry Pi CPU, and as a direct result temperature readings suffer greatly.
There are open air case designs to mitigate this, but the way I found to “fix” this in my current setup is to mount the Pi vertically, with the CPU (and the [Enviro+] screen) upwards.
This design flaw in Pimoroni sensor boards goes back to the original EnviroHAT (of which I have no less than two, so I was aware of it), and Pimoroni has tried to counter it by both adding a slight gap around the temperature sensor and by trying to offset the CPU temperature from measurements in their sample code.
That leads to really weird effects like the apparent temperature dropping whenever the CPU temperature increases (like shown in my first chart above), which is just plain wrong.
So the only real solution is careful setup and proper airflow (and, if you can squeeze it in, a CPU heatsink to wick away the heat).
-
They also have announced an all-in-one Pico W board called Enviro Urban that looks like it can do everything I need, but neither it nor the Pico W were available at the time. I will quite likely be getting a couple of those in a few weeks. ↩︎
-
Well, at least I didn’t see any correlation in my charts between printing activity and any of the values, ↩︎
-
Also, the Pimoroni-supplied code does not seem to be very well documented or good enough at interpreting some sensor values, which doesn’t fill me with confidence here. ↩︎