 Rui Carmo
I’ve been using NewRelic for a little over a year, and it’s been exceedingly useful to me – I keep track of all my personal servers through it, and so far it’s been enough.
However, I’ve been methodically going through the entire Azure portfolio as part of my work, so trying out Application Insights on my own stuff has been in the cards for a few months now, and this weekend I found some time to get started on it.
Measuring Snakes
Obviously, Application Insights targets .NET and Java first, but there’s increasing support for other runtimes. The Python SDK is quite mature and makes it trivial to instrument a WSGI application, so last weekend I grabbed this very site’s Bottle app and patched it up thusly:
import hy
from bottle import DEBUG, default_app
from sushy.config import DEBUG_MODE, INSTRUMENTATION_KEY
import sushy.routes

import newrelic.agent
newrelic.agent.initialize()

DEBUG = DEBUG_MODE

if INSTRUMENTATION_KEY:
    from applicationinsights.requests import WSGIApplication
    app = WSGIApplication(INSTRUMENTATION_KEY, default_app())
else:
    app = default_app()
…and yes, you can run NewRelic simultaneously if you either don’t want to switch wholesale or if (like me) you like obsessing over comparisons.
The only real difference (for my setup) is that I needed to instrument the browser side separately by adding a script tag, and presto, you can then go over to your Application Insights instance inside the Azure Portal and add a few new charts to your dashboard.
Viewing Performance Data
Most of this site’s traffic is off-loaded to CloudFlare, so load on my server tends to be fairly small (which is why I can get away with a smaller VM these days), but there’s still enough to look at, and the default views look like this:
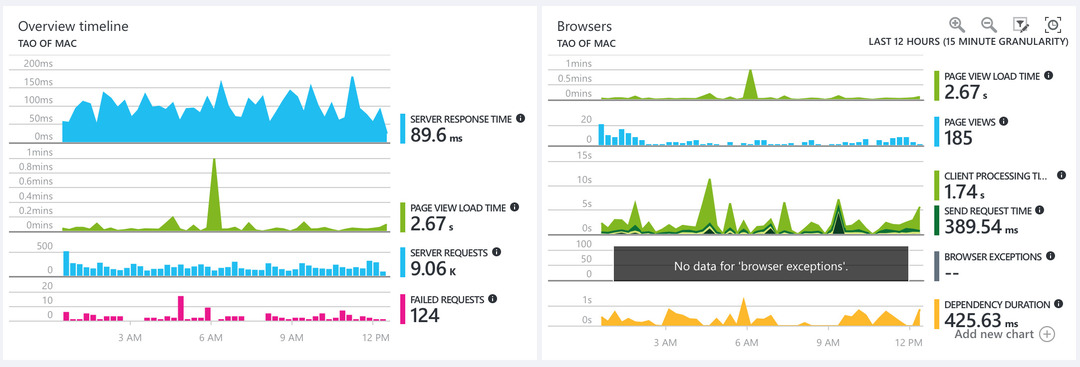
These are stats from last Sunday morning: server response time as measured both server and client side, total number of requests, and failures (including 404s and my favorite – 401 Banned – for a few nuisance web crawlers).
On the right hand side you get a little more detail on the client experience, including external script loading times – which, for a CloudFlare hosted site, includes their countermeasure scripts as well as the usual analytics stuff.
From Russia, With Love
The neat thing about Application Insights, as far as I’m concerned, is that you can drill down on data to your heart’s content. Besides exporting your data to PowerBI and accessing a separate analytics portal with an interactive query language, you can interactively slice and dice it directly on the Azure portal.
For instance, when I noticed a particularly slow web transaction (which is rare, since this site is behind CloudFlare and full page loads tend to be very fast), I can single out that time period on the chart (left pane), locate the relevant request (middle pane) and then get the detailed info (right pane):
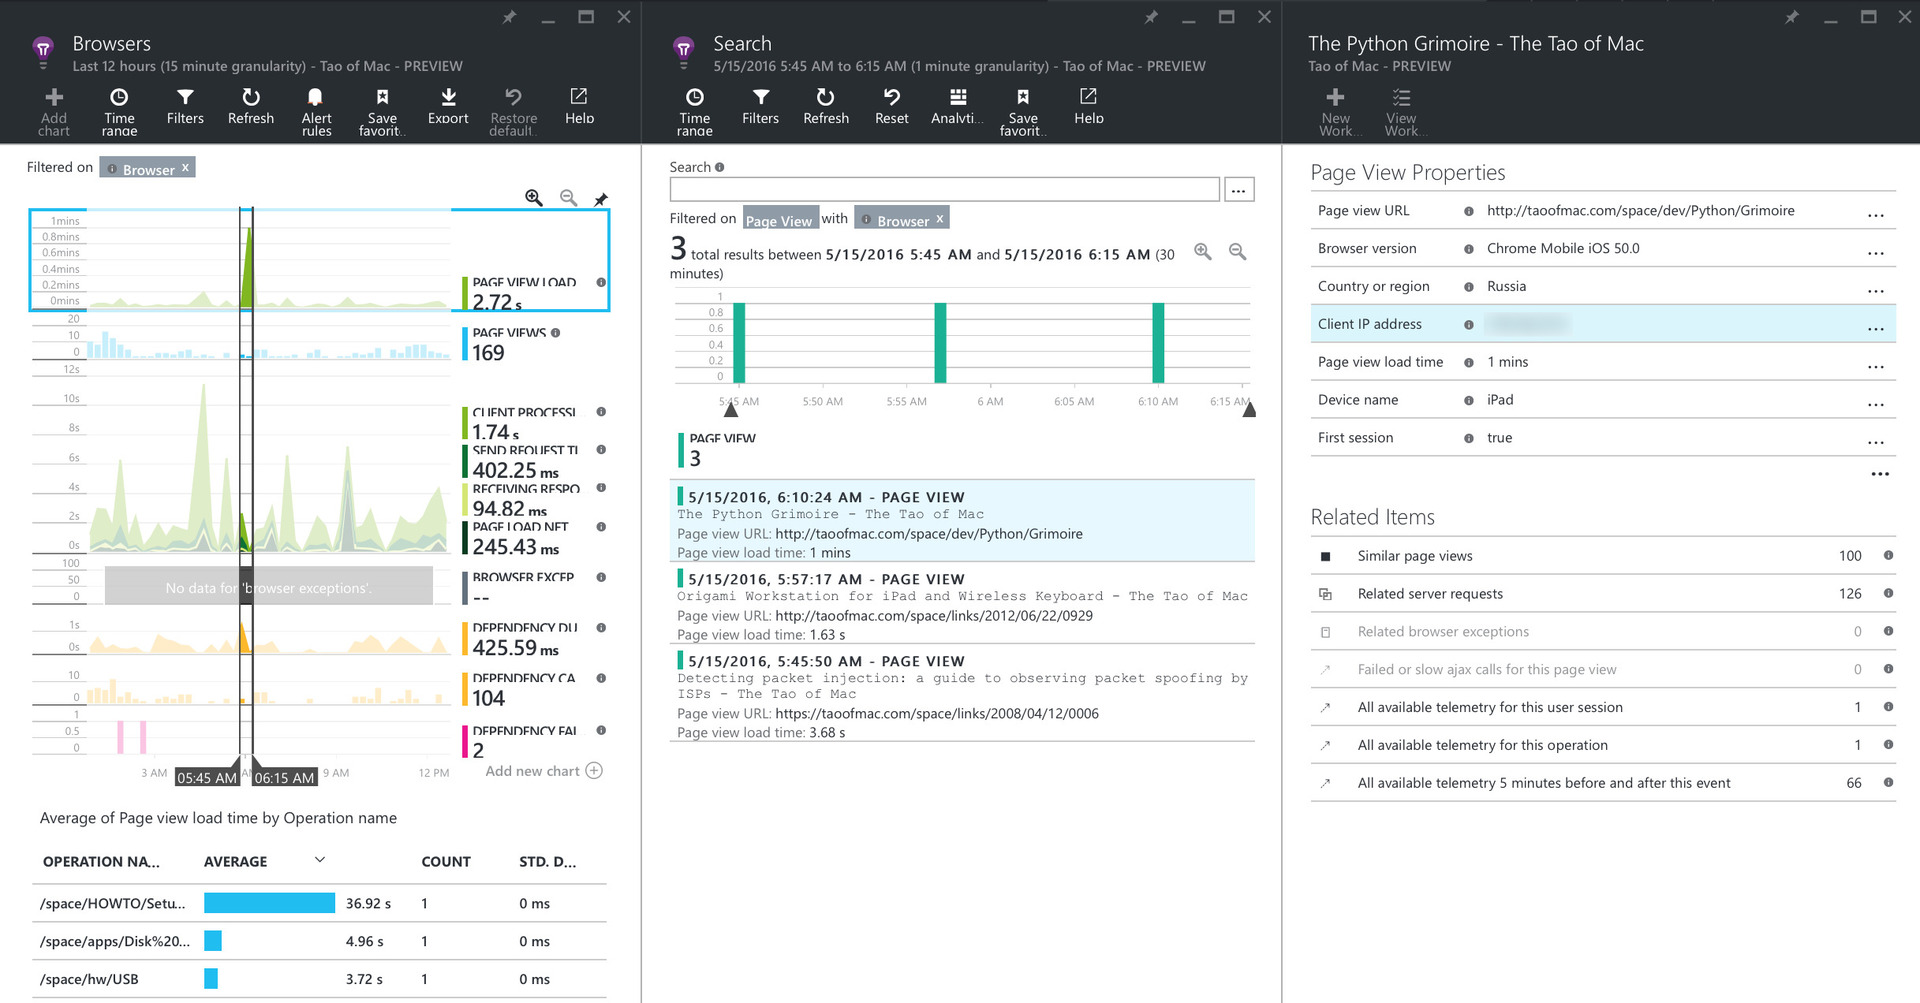
And I can then click “All available telemetry for this user session” and go through it. In this case there is only the one request due to CloudFlare caching, but it’s all too easy to click around enthralled for hours.
So, overall, it’s a win. A bit different from what I was used to with NewRelic, but the only thing I miss off the bat is a dedicated mobile app – even if the charts on the NewRelic mobile app are a bit whimsical (and sometimes blank for some reason), it’s pretty handy.
Like I mentioned above, you can import your Application Insights data into PowerBI, but sadly, I can’t get my data to show up just yet – I suspect the delay’s due to my using the Free Tier, but haven’t spent too long on it (I’m playing around with this stuff on my personal Azure subscription, so I’m not twiddling all the knobs at once).
But the Analytics site makes up for it in terms of interactive exploration, so it’s not an apples-to-oranges comparison anyway.
Custom Events and System Monitoring
Another thing I’m quite enjoying is that I can add custom events, track exceptions and instrument non-web services at will on the Application Insights Free tier, which is something you can’t do on NewRelic’s.
Custom events show up just fine on both the Azure and Analytics portals, so I’m pretty much set on that regard. So the only thing missing for me on Application Insights are server/process metrics like the ones I have right now:
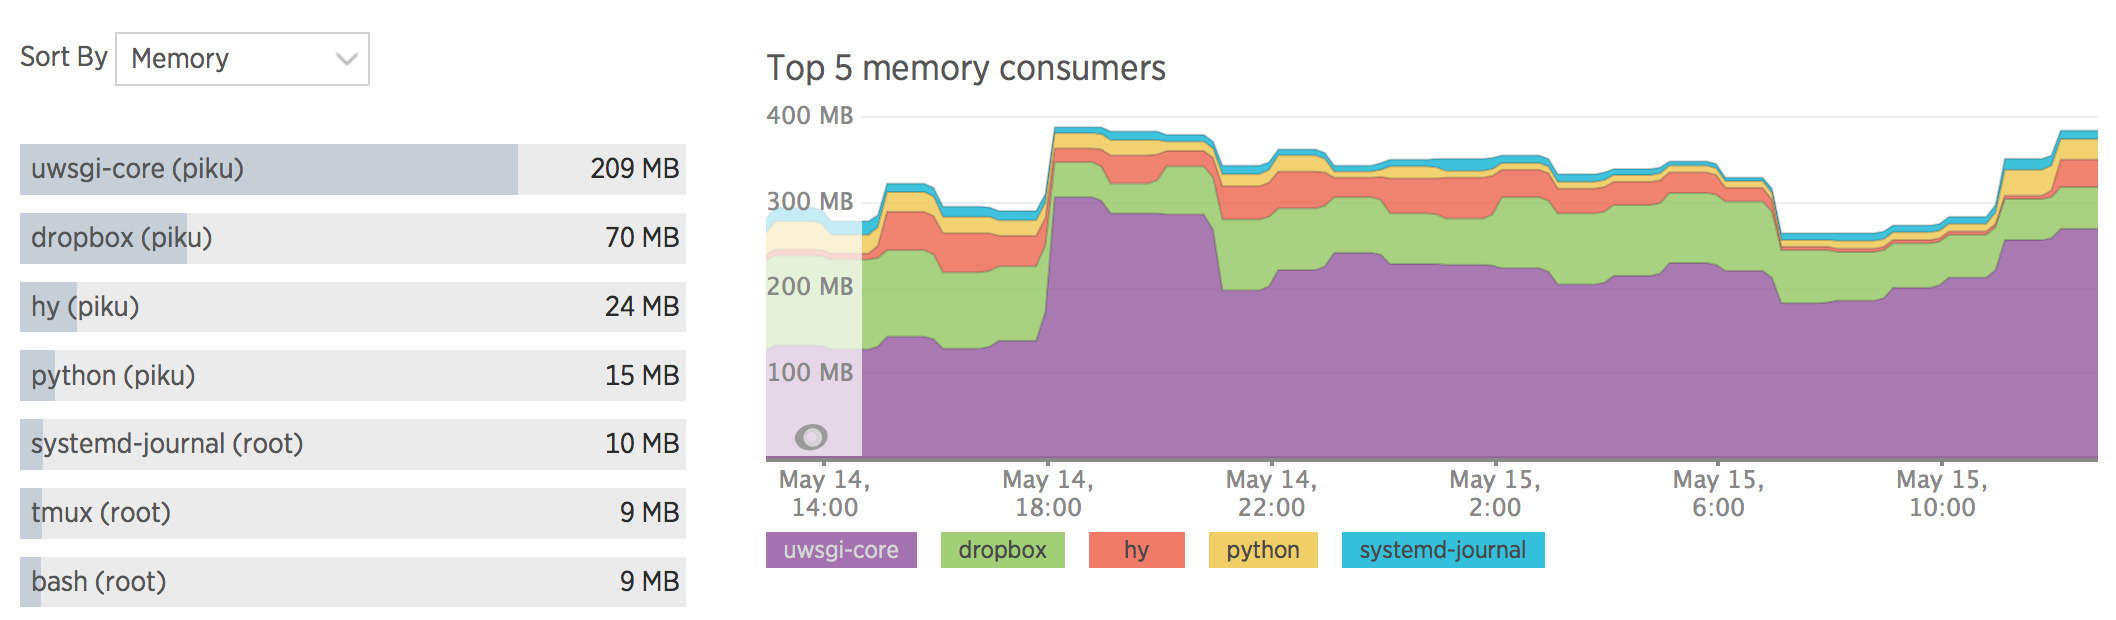
This is simply because the Application Insights server agent is Windows-only (for the moment), but there’s already an Operations Management Suite agent for Linux, so I’m going to dig into that and see if it can tide me over for a bit.